Tracking and Displaying Performance Metrics
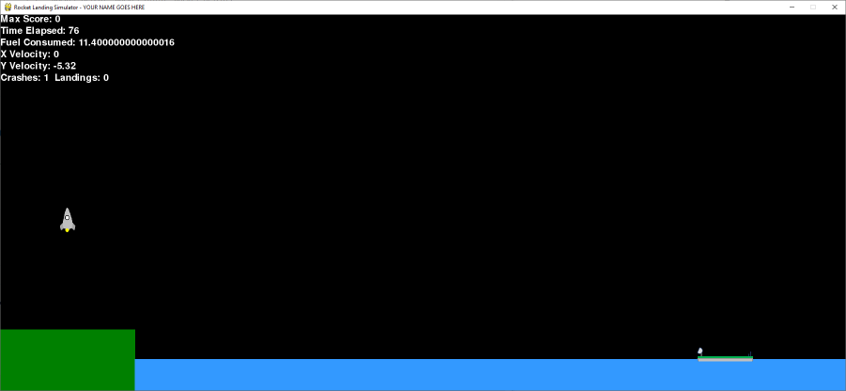
In addition to player controls, we also need to keep track of some basic performance metrics. These metrics are intended to be displayed in an area of the screen that we refer to as the heads up display (or HUD for short). An example HUD is displayed below.
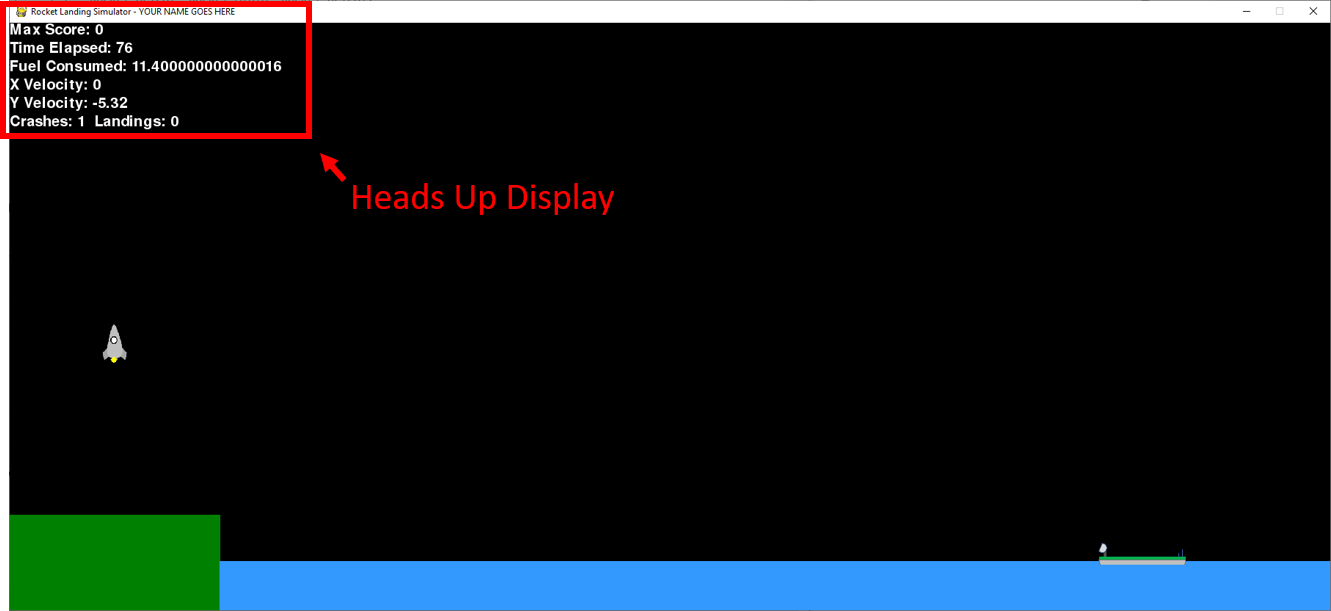
Specifically, there are 5 things that we want our simulation to track:
- The max player score
- The time elapsed since the simulation started (in frames)
- The amount of "fuel" consumed (we'll talk about that in a second)
- The rocket's current x and y velocity
- The total # of crashes versus landings across all runs
Let's look at each of these items, and see how we can implement them.
Max Score
Each time the simulation ends, your program will assign it a score (more on that in the following section). The max score variable keeps track of the highest score across all runs.
To track this performance metric, create a variable under the # Performance Variables section, and assign it the value of 0.
Time Elapsed
The time elapsed refers to the number of frames that have been drawn since the rocket Boosted from the pad. This value should start at 0 in each simulation run, and increment each time a complete frame is drawn to the screen.
To track this performance metric, create a variable under the # Performance Variables section, and assign it the value of 0. Then . . .
Fuel Consumed
For this PEX, the fuel consumed will represent the total amount of thrust that applied to the rocket over the course of the simulation run. This value should start at 0 at each simulation run, and increment each time the player chooses to accelerate in the left, right, or up directions. For example, if the user decides to accelerate 0.3 in the right direction for one frame, and 0.3 in the left direction the next frame, the total fuel consumed would be 0.6 (0.3 + 0.3 = 0.6).
To track this performance metric, create a variable under the # Performance Variables section, and assign it the value of 0. Then do the following . . .
X and Y Velocity
This one is super easy! You already keep track of the rocket's X and Y velocity, so all you will have to do is print it to the HUD.
Crashes vs Landings
This one is pretty self explanatory. You need two variables that start at 0, and are incremented whenever the rocket crashes into the terrain or lands on the boat, respectively.
To track this performance metric, create both variables under the # Performance Variables section, and assign them the value of 0. We will then update them in the following section.
Creating the HUD
To create the heads up display, simply go to the draw_hud() function and use pythonGraph's draw_text function to write each of the variables mentioned above to the screen. You will have to experiment with the (x, y) coordinates and font size to figure out what you like. Refer to the pythonGraph documentation if you have any questions.
One of the common errors that we see in this section is when students try to combine a string and number using draw_text. To help you out, here is a quick trivia question: