Post-It Pandemonium
Jeffrey L. Popyack, Drexel University, Popyack@Drexel.edu
Table of Contents:
back to Table of Contents
About Post-It Pandemonium:
Post-It Pandemonium is an “unplugged” activity that exposes data structures and algorithms involved in image representation and compression, using multi-colored Post-It Notes®.
We use Post-Its to illustrate how color images can be encoded and decoded so they can be stored efficiently on a computer and/or transmitted efficiently across a network. This provides an intuitive illustration of bitmaps and the GIF (Graphics Interchange Format), optimized with Lempel-Ziv compression. The algorithms are simple to explain and comprehend, and simultaneously appeal to the participants’ sense of art and creativity while demystifying advanced computing concepts and computer graphics.
We have several variants of this activity, but the most popular has involved a group of people decoding instructions and creating individual pages, which together produce one large image.
Included in this website are:
-
overview of the project
-
sample outputs
-
link to sample lab activities and followup questions
-
instructions for creating your own Post-It project, using our software
Example:
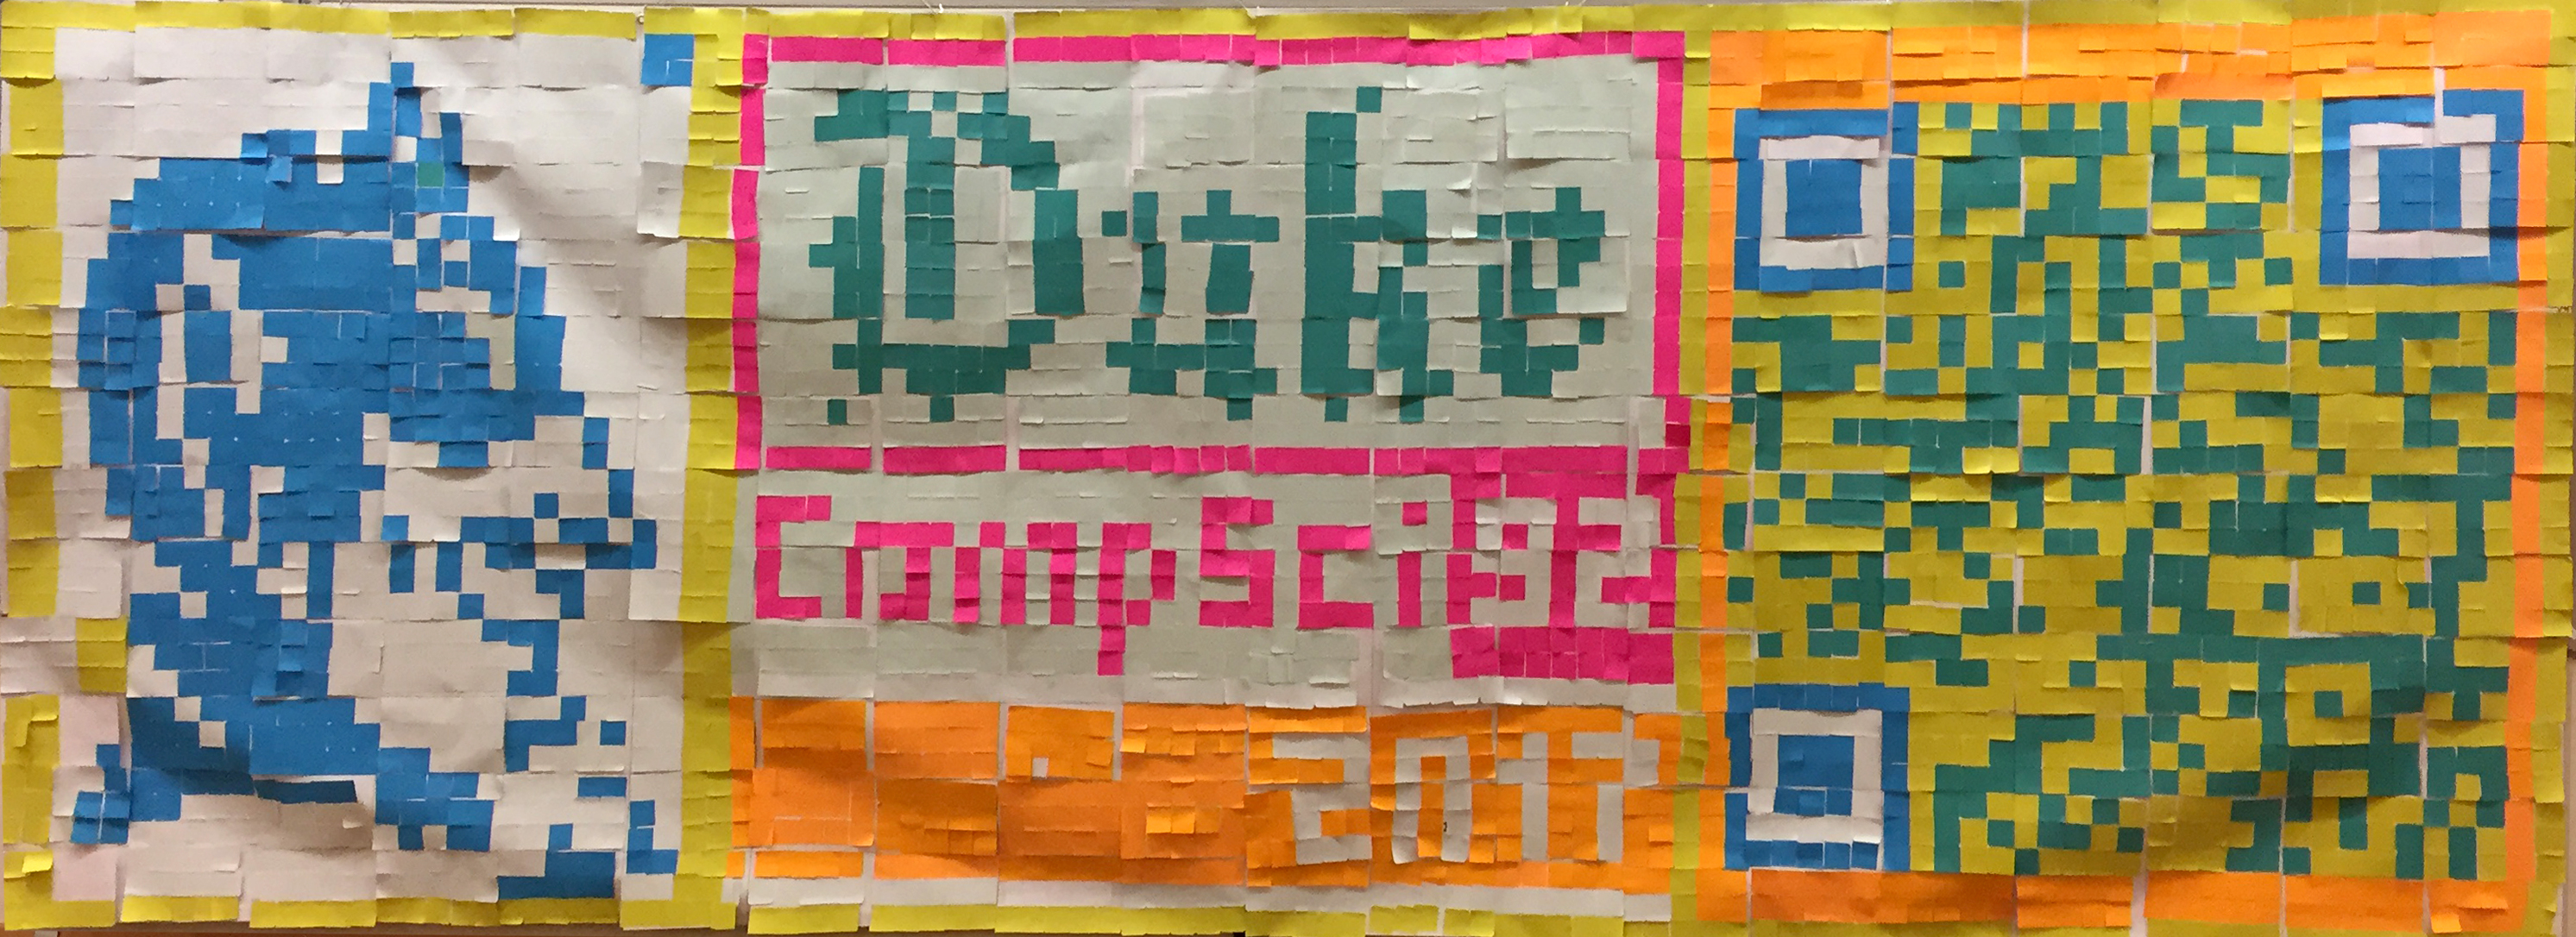
The video below shows a time-lapse sequence of students assembling a 100×36 GIF image with 2" square Post-It's, resulting in an image that is roughly 17 feet wide by 6 feet high.
CompSci 92 students at Duke University, Spring 2017, which I co-taught while on sabbatical. Video by co-instructor R. Lucic.
Note: the QR code seen in the final product works properly - try it! It opens a page in my webspace at Duke (which is still active as of October 2018). The page contains a simple script which redirects the browser either to the CompSci 92 website, or else "Rick-roll's" the user and displays a video for the Rick Astley song "Never Gonna Give You Up".
back to Table of Contents
How to Use This Exercise:
We have used this activity in multiple settings:
-
Ice-breaker activity for groups of incoming freshmen (Drexel University, 2015-2017)
-
In-class activity for a college CS Principles lecture section with 100+ students (Duke University, 2017, above)
-
Closed lab activity for multiple lab sections with one combined outcome (Drexel University, 2017)
-
Summer tech camp activity for middle school girls (Robot Springboard @ Drexel, 2017-2018)
-
Computer Science Education Week activity for high school students (George Washington Carver High School for Engineering and Science, Philadelphia, PA/Brent Gray, instructor; Owen J. Roberts High School, Pottstown, PA/Gloria Houseman, instructor)
-
Worldwide Meeting of Computer Science Educators (SIGCSE Symposium, 2016)
-
Technology Showcase/Social (Philadelphia Science Festival, 2016)
-
CS4Philly CS Week: CS Student Experience activity for over 100 stduents from 11 Philadelphia high schools (Kimmel Center, Philadelphia, CS Education Week, December 2018)
This activity has proven to engage participants with a wide variety of backgrounds, and provides the background needed for further exploration and discussion of Computer Science Principles, specifically the Big Ideas of Creativity, Abstraction, Data and Information, and Algorithms.
Classroom Use:
To see how this is used in closed lab activities, click HERE . (This lab exercise in Fall 2017 produced the image seen in GALLERY item (b), below.)
Sample Student Responses to Lab Activities:
Q: GIF images: GIF images use a color table which assigns a number to each distinct color in the image, and then for each pixel, stores the position of its color in the table. For instance, our image contains as many as 8 distinct colors, and so the entire image is encoded with numbers in the range 0..7 . Explain what will happen to the image if the values in the color table get changed, i.e., we switch the values in positions 1 and 7.
A: The image itself will not change it will just make the places that were originally light blue into orange and the other way around. The image may appear to be incorrect though.
Q: Black and White: Suppose you'd like to re-create today's image, but instead of Post-It notes, you are going to use pieces of construction paper. Unfortunately, the only colors of paper you have are black and white. Explain how you could create a black-and-white version of this image by making some simple changes to the color table.
A: One could change the color table so that the darker colors are black, and the lighter colors are white. Then, one could also correspond lighter tones of black and white based on how light or dark each color is, if one can create intermediate colors for black and white such as grey.
Q: Compression: The run-length encoding compression algorithm replaces consecutive occurrences of a number K with two numbers, n and K, where K is the color and n is the number of consecutive occurrences. For instance, the sequence "4 4 4 4 4 4" in the original image is replaced by "6 4". For an image with 15 pixels, the highest compression occurs when all 15 of the colors are the same - if the entire image is the color "4", the compressed image is encoded as "15 4".In some cases, however, compression won't be effective. It may actually take more values to encode the "compressed" image than the original image. In the worst case, how many values will it take to encode an image with 15 pixels using the run-length encoding compression algorithm? Explain.
A: In the worst case, it could take 30 values to encode the image. This would be a result of each color being different from the color before it, therefore each number would only be multiplied by 1, for example: 1 7 1 5 1 3 1 2 1 5.... Although one may have color repeats, as long they are not next to each other they would still need to be represented separately.
Q: Compression, continued: Using this compression algorithm, which of these images would produce better compression: an image with horizontal stripes or one with vertical stripes? Explain.
A: Using horizontal stripes would produce the most compression since it is the same color going across, rather than constantly changing color going across.
back to Table of Contents
GALLERY:
-
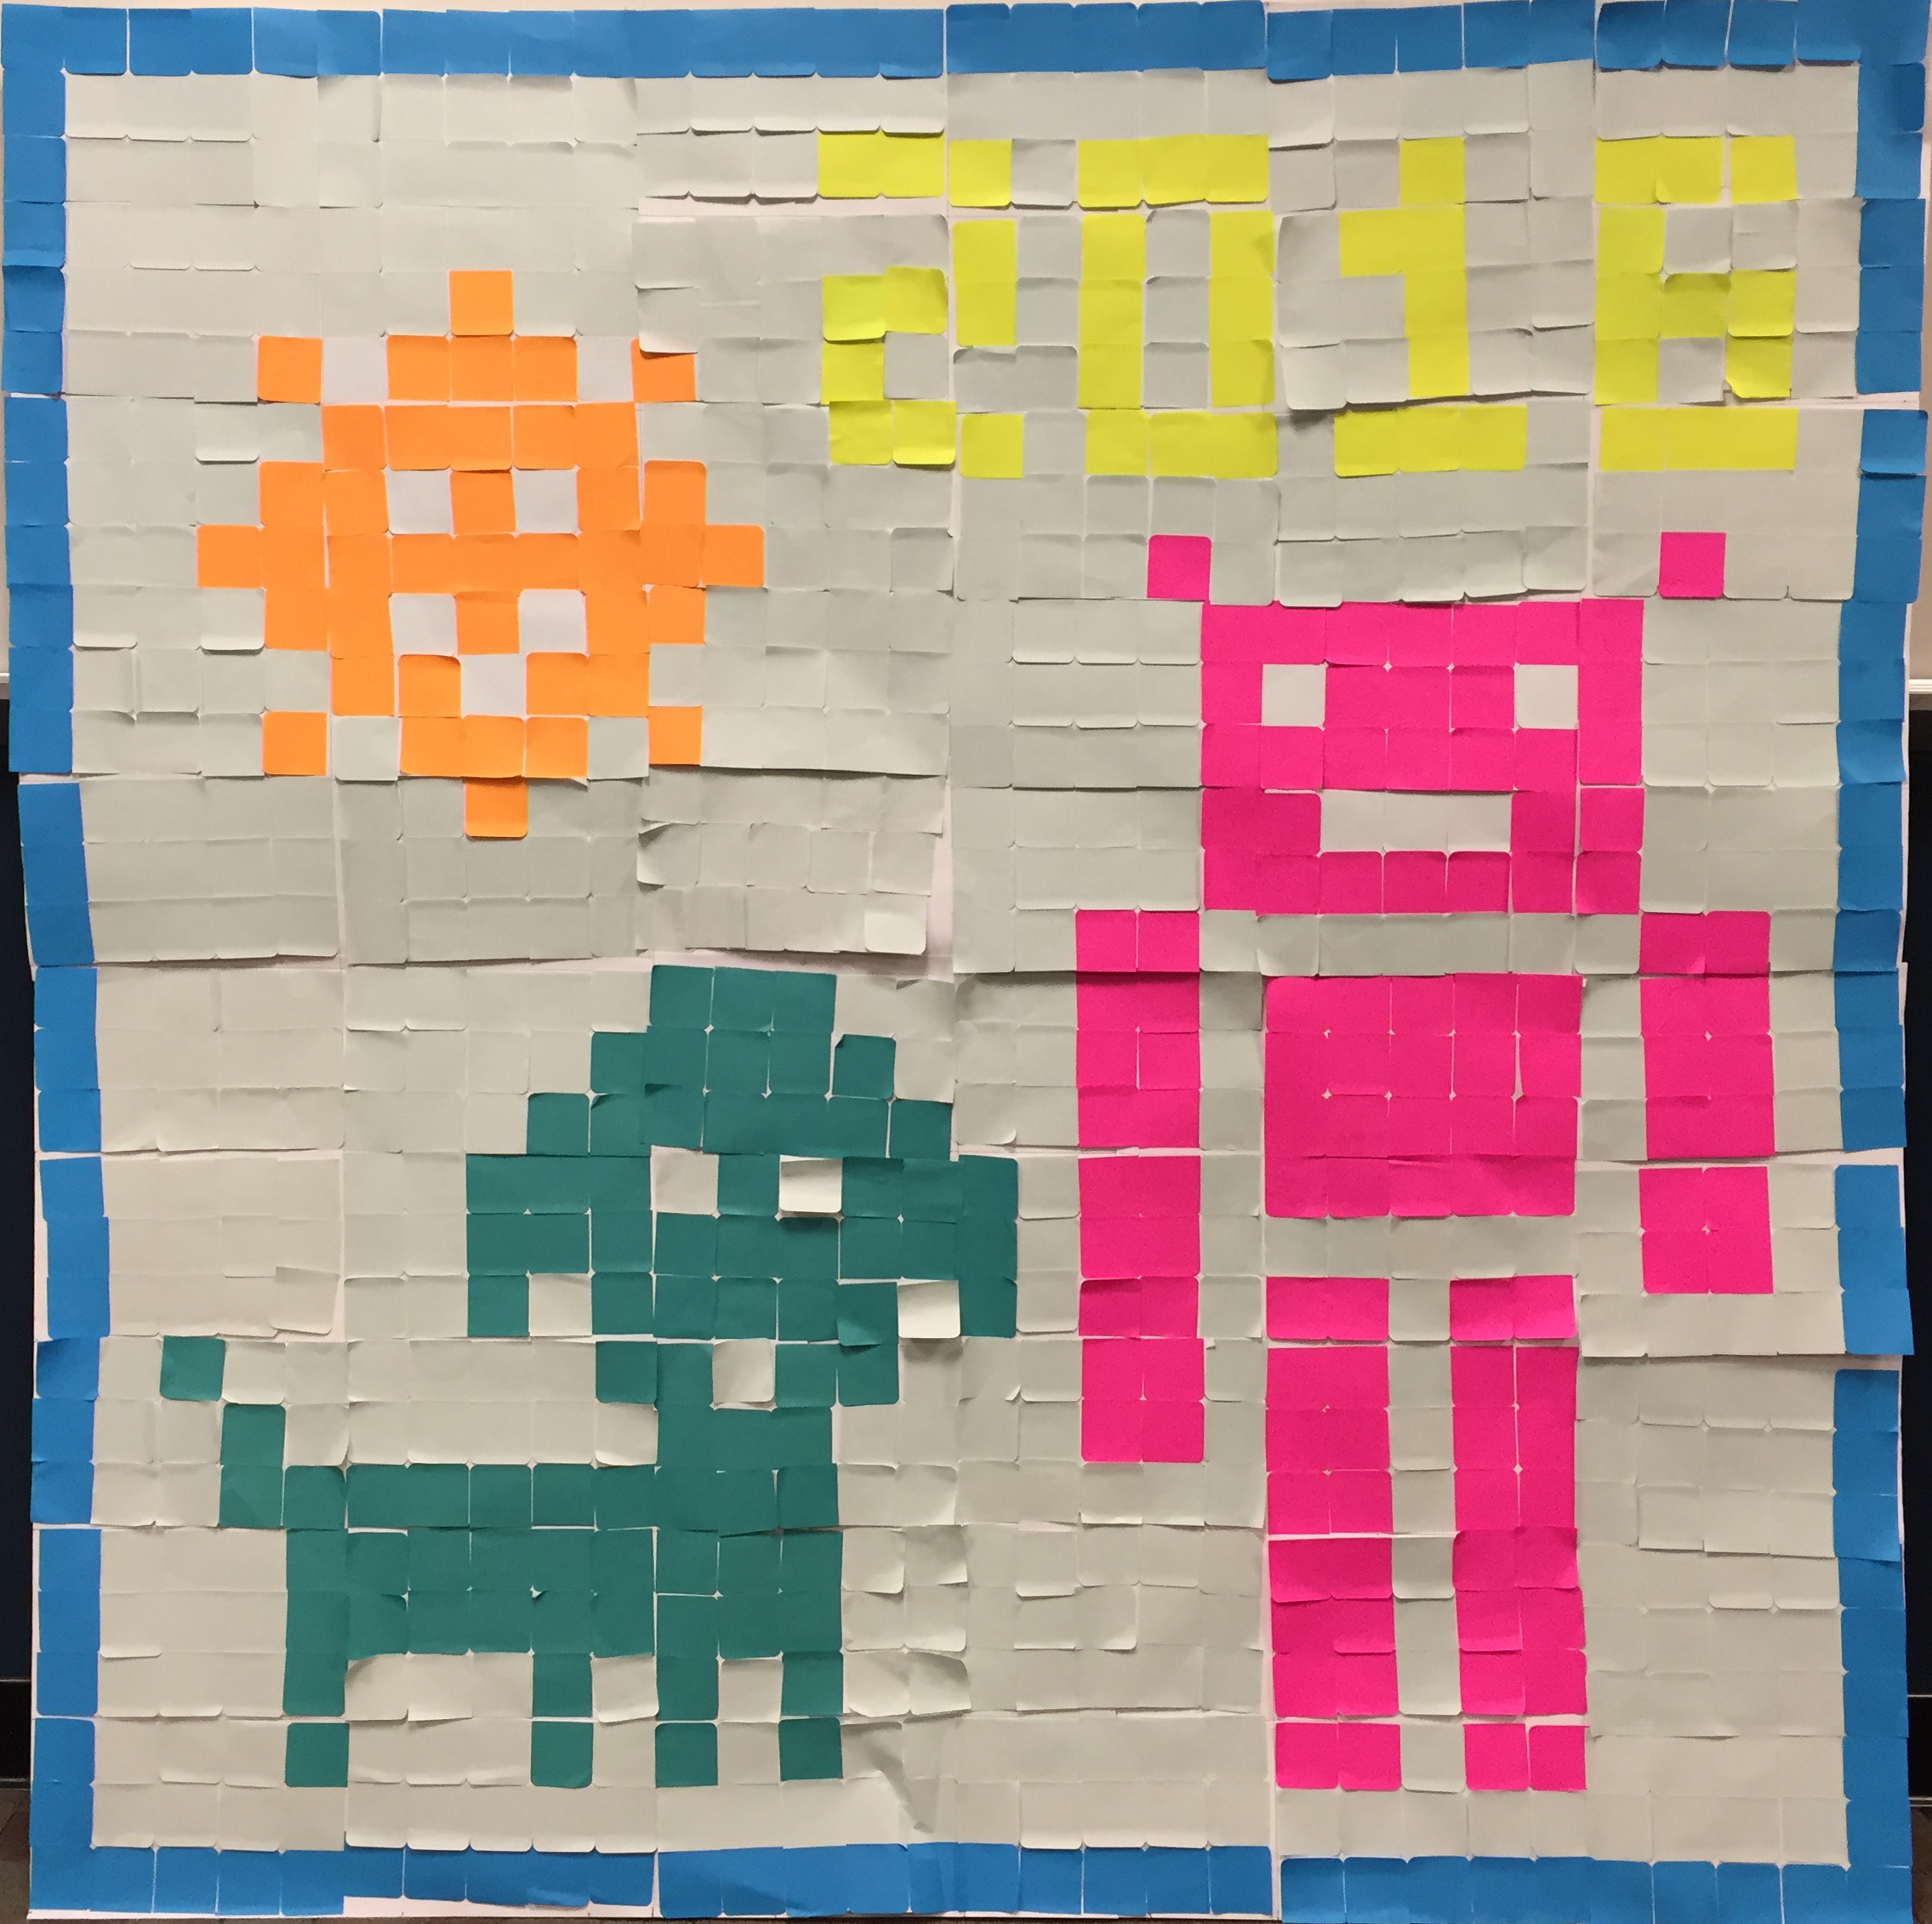
Ice-breaker activity for incoming freshmen (Drexel University, 2015)

Our first time! We used 3"x3" square Post-Its and the image is about 7'×7'. The QR code works, too, directing the viewer to our college's website.
-
Closed lab activity for multiple lab sections with one combined outcome (Drexel University, 2017)
Click HERE to see the lab activities the students followed for this, and the questions they answered.
-
In-class activity for a college CS Principles lecture section with 100+ students (Duke University, 2017, see video above)
-
Summer tech camp activity for middle school girls (Robot Springboard @ Drexel, 2017-2018)
This animated GIF was created by stitching together several GIF's that only differ by a few pixels. The girls put together the original image, then we altered it and re-photographed several times using a camera with a tripod.
-
Worldwide Meeting of Computer Science Educators (SIGCSE Symposium, Memphis, TN 2016)
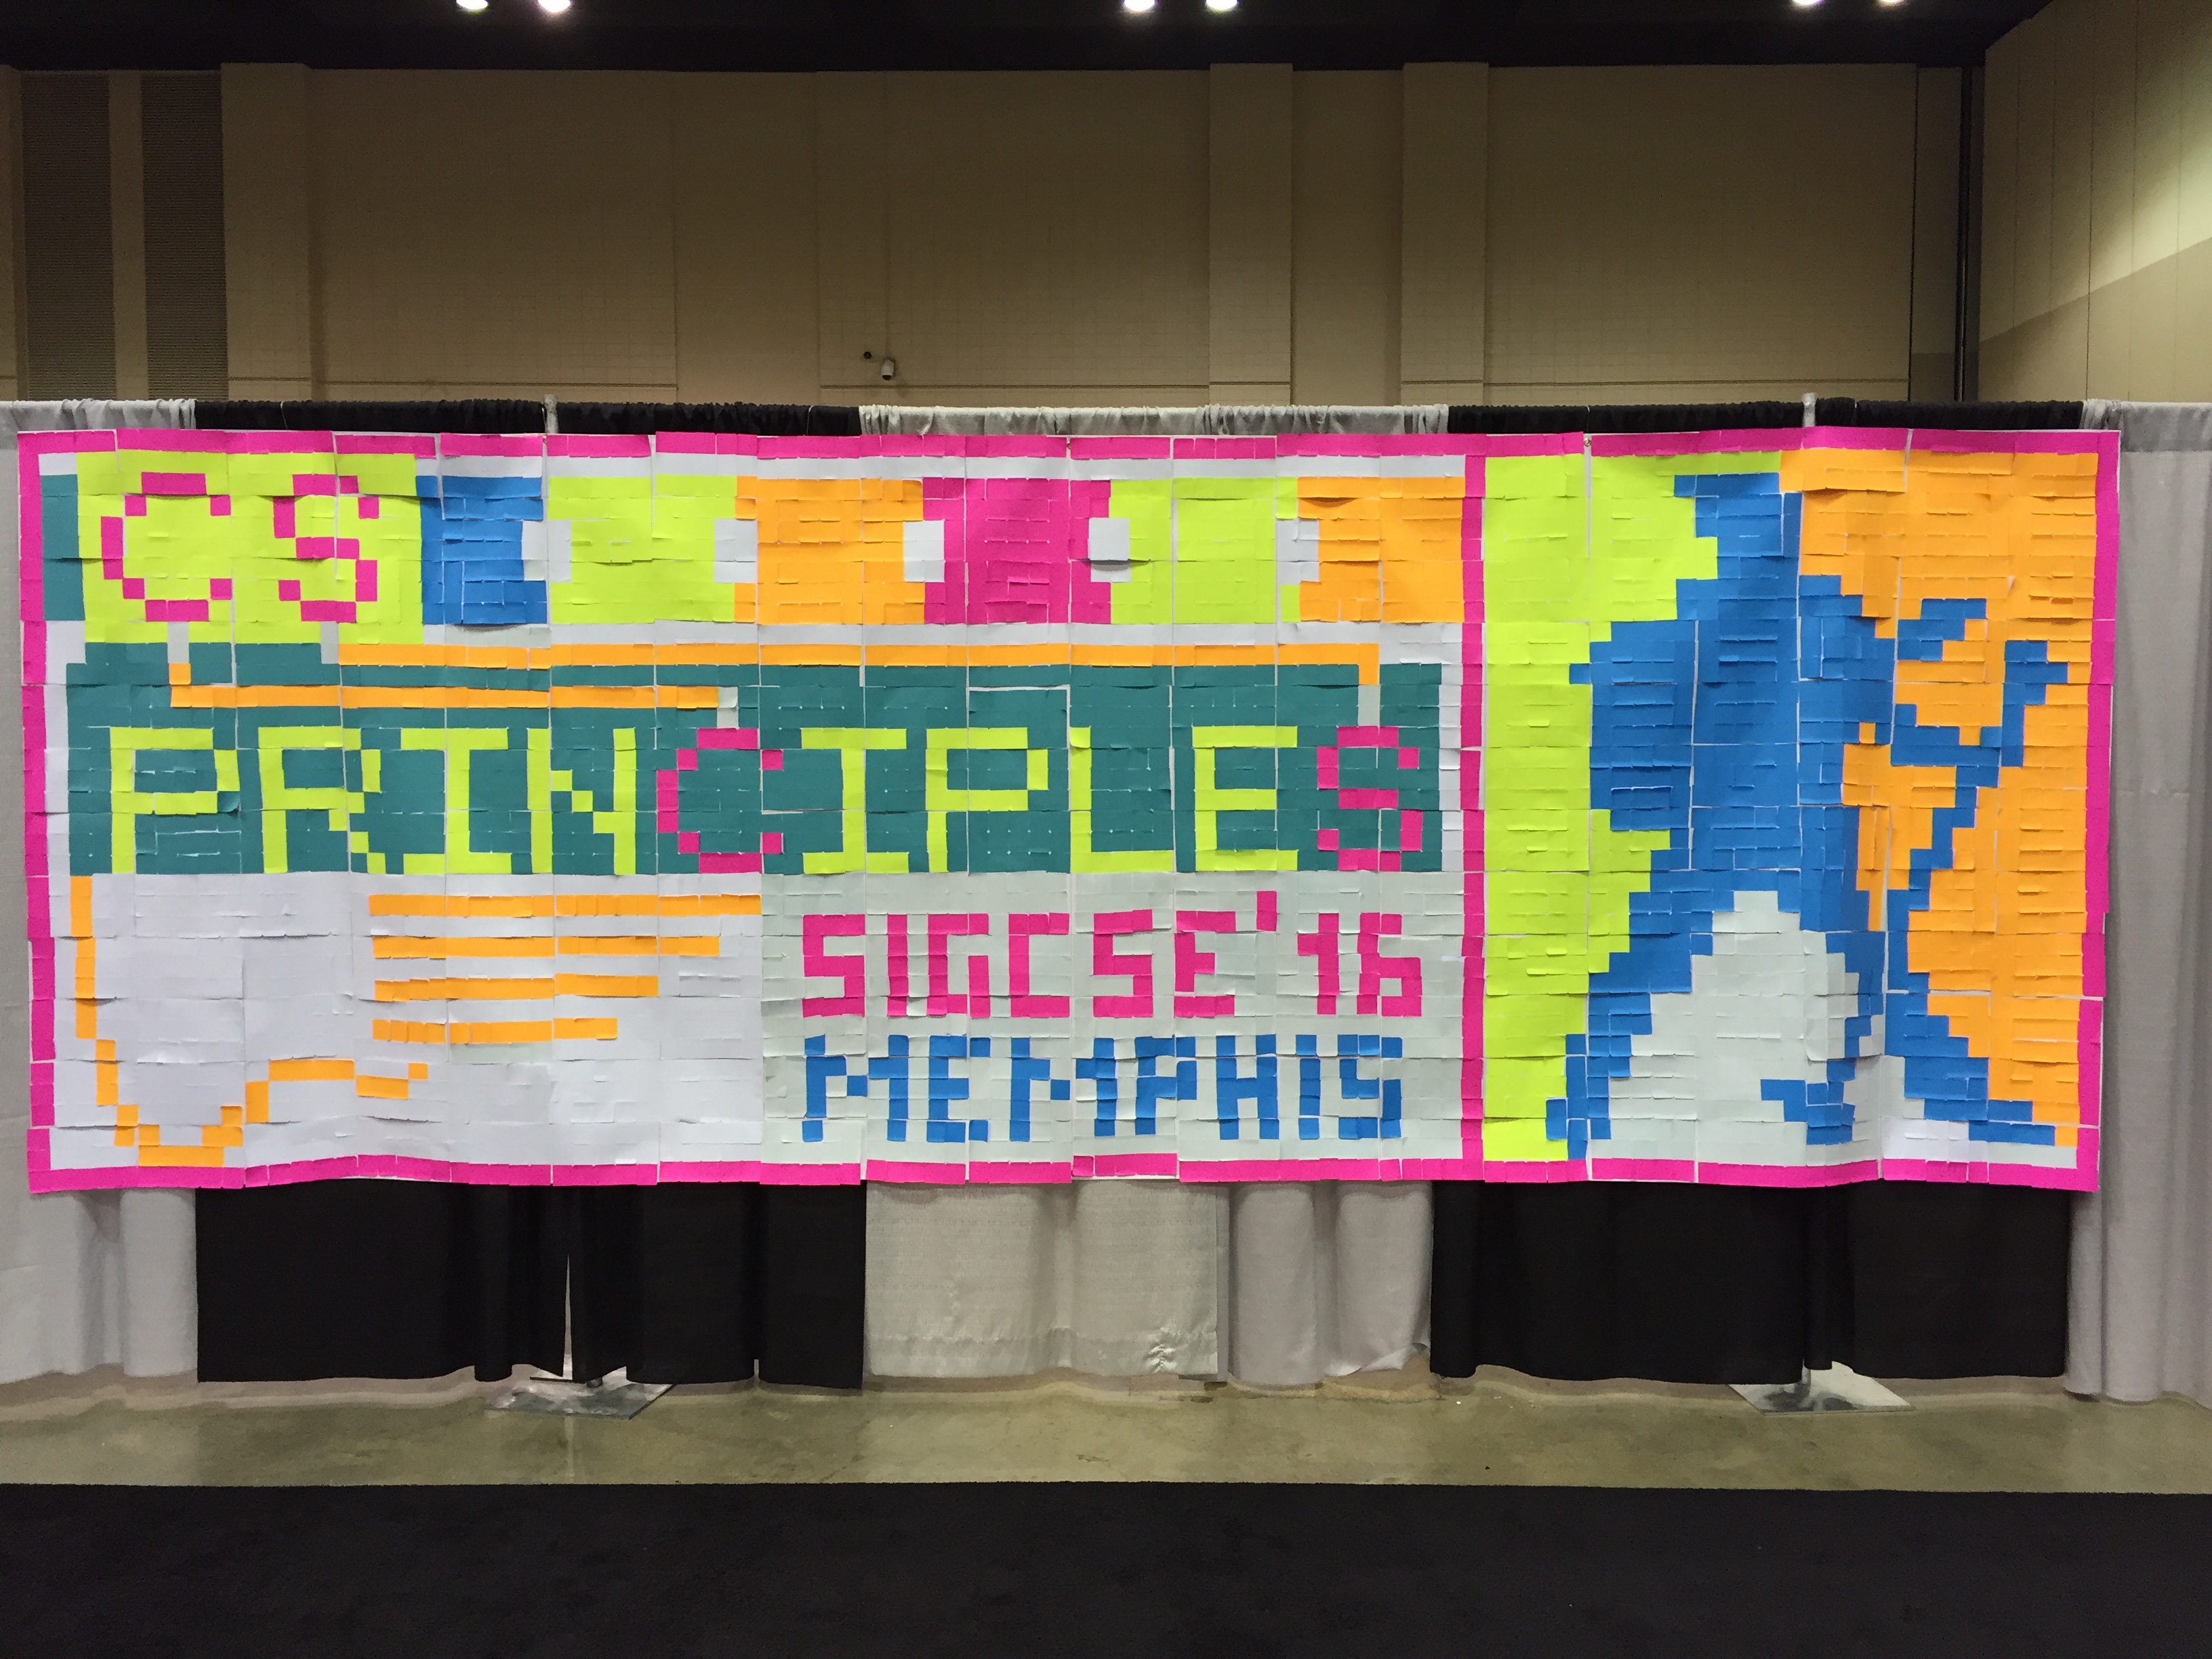
Click here for more images of this project in action.
-
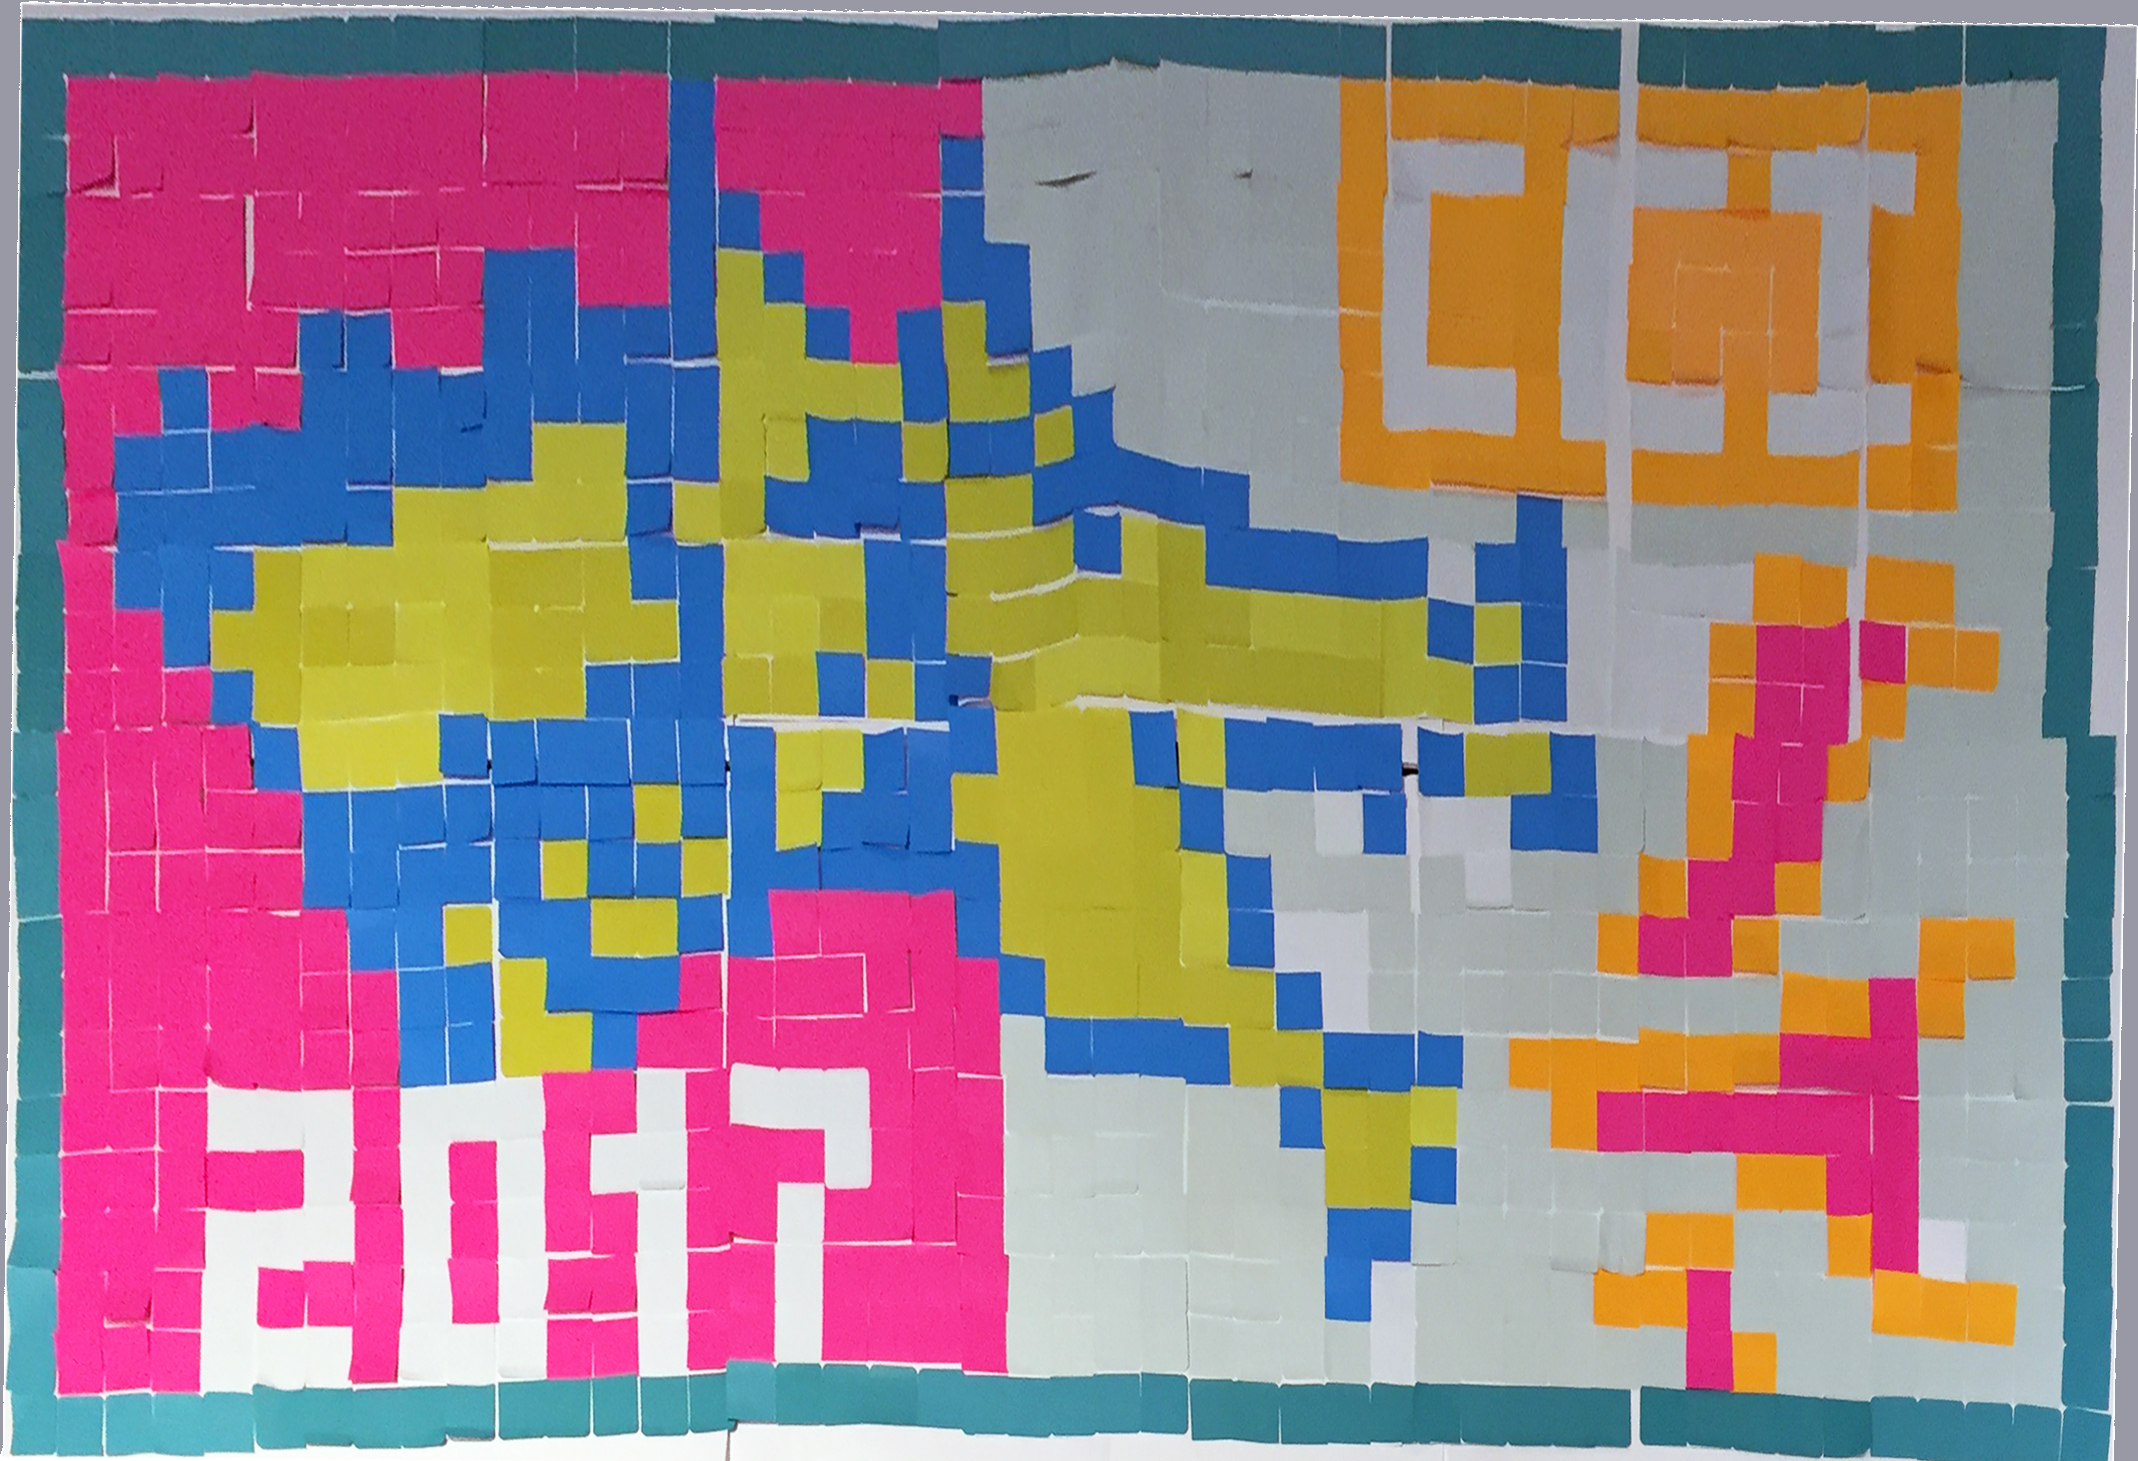
Technology Showcase/Social (Philadelphia Science Festival, 2016)

This was done in a "Science After Hours" event at the Franklin Institute, featuring hundreds of STEM activities
provided by program partners, and more than 1700 attendees. Our 17' banner got placed in a corner in a basement, but we still got a lot of participants. The Franklin Institute's featured display at the time was The Science of Pixar, and so we chose these images to render.
-
CS4Philly's "Student CS Experience", December 2018:
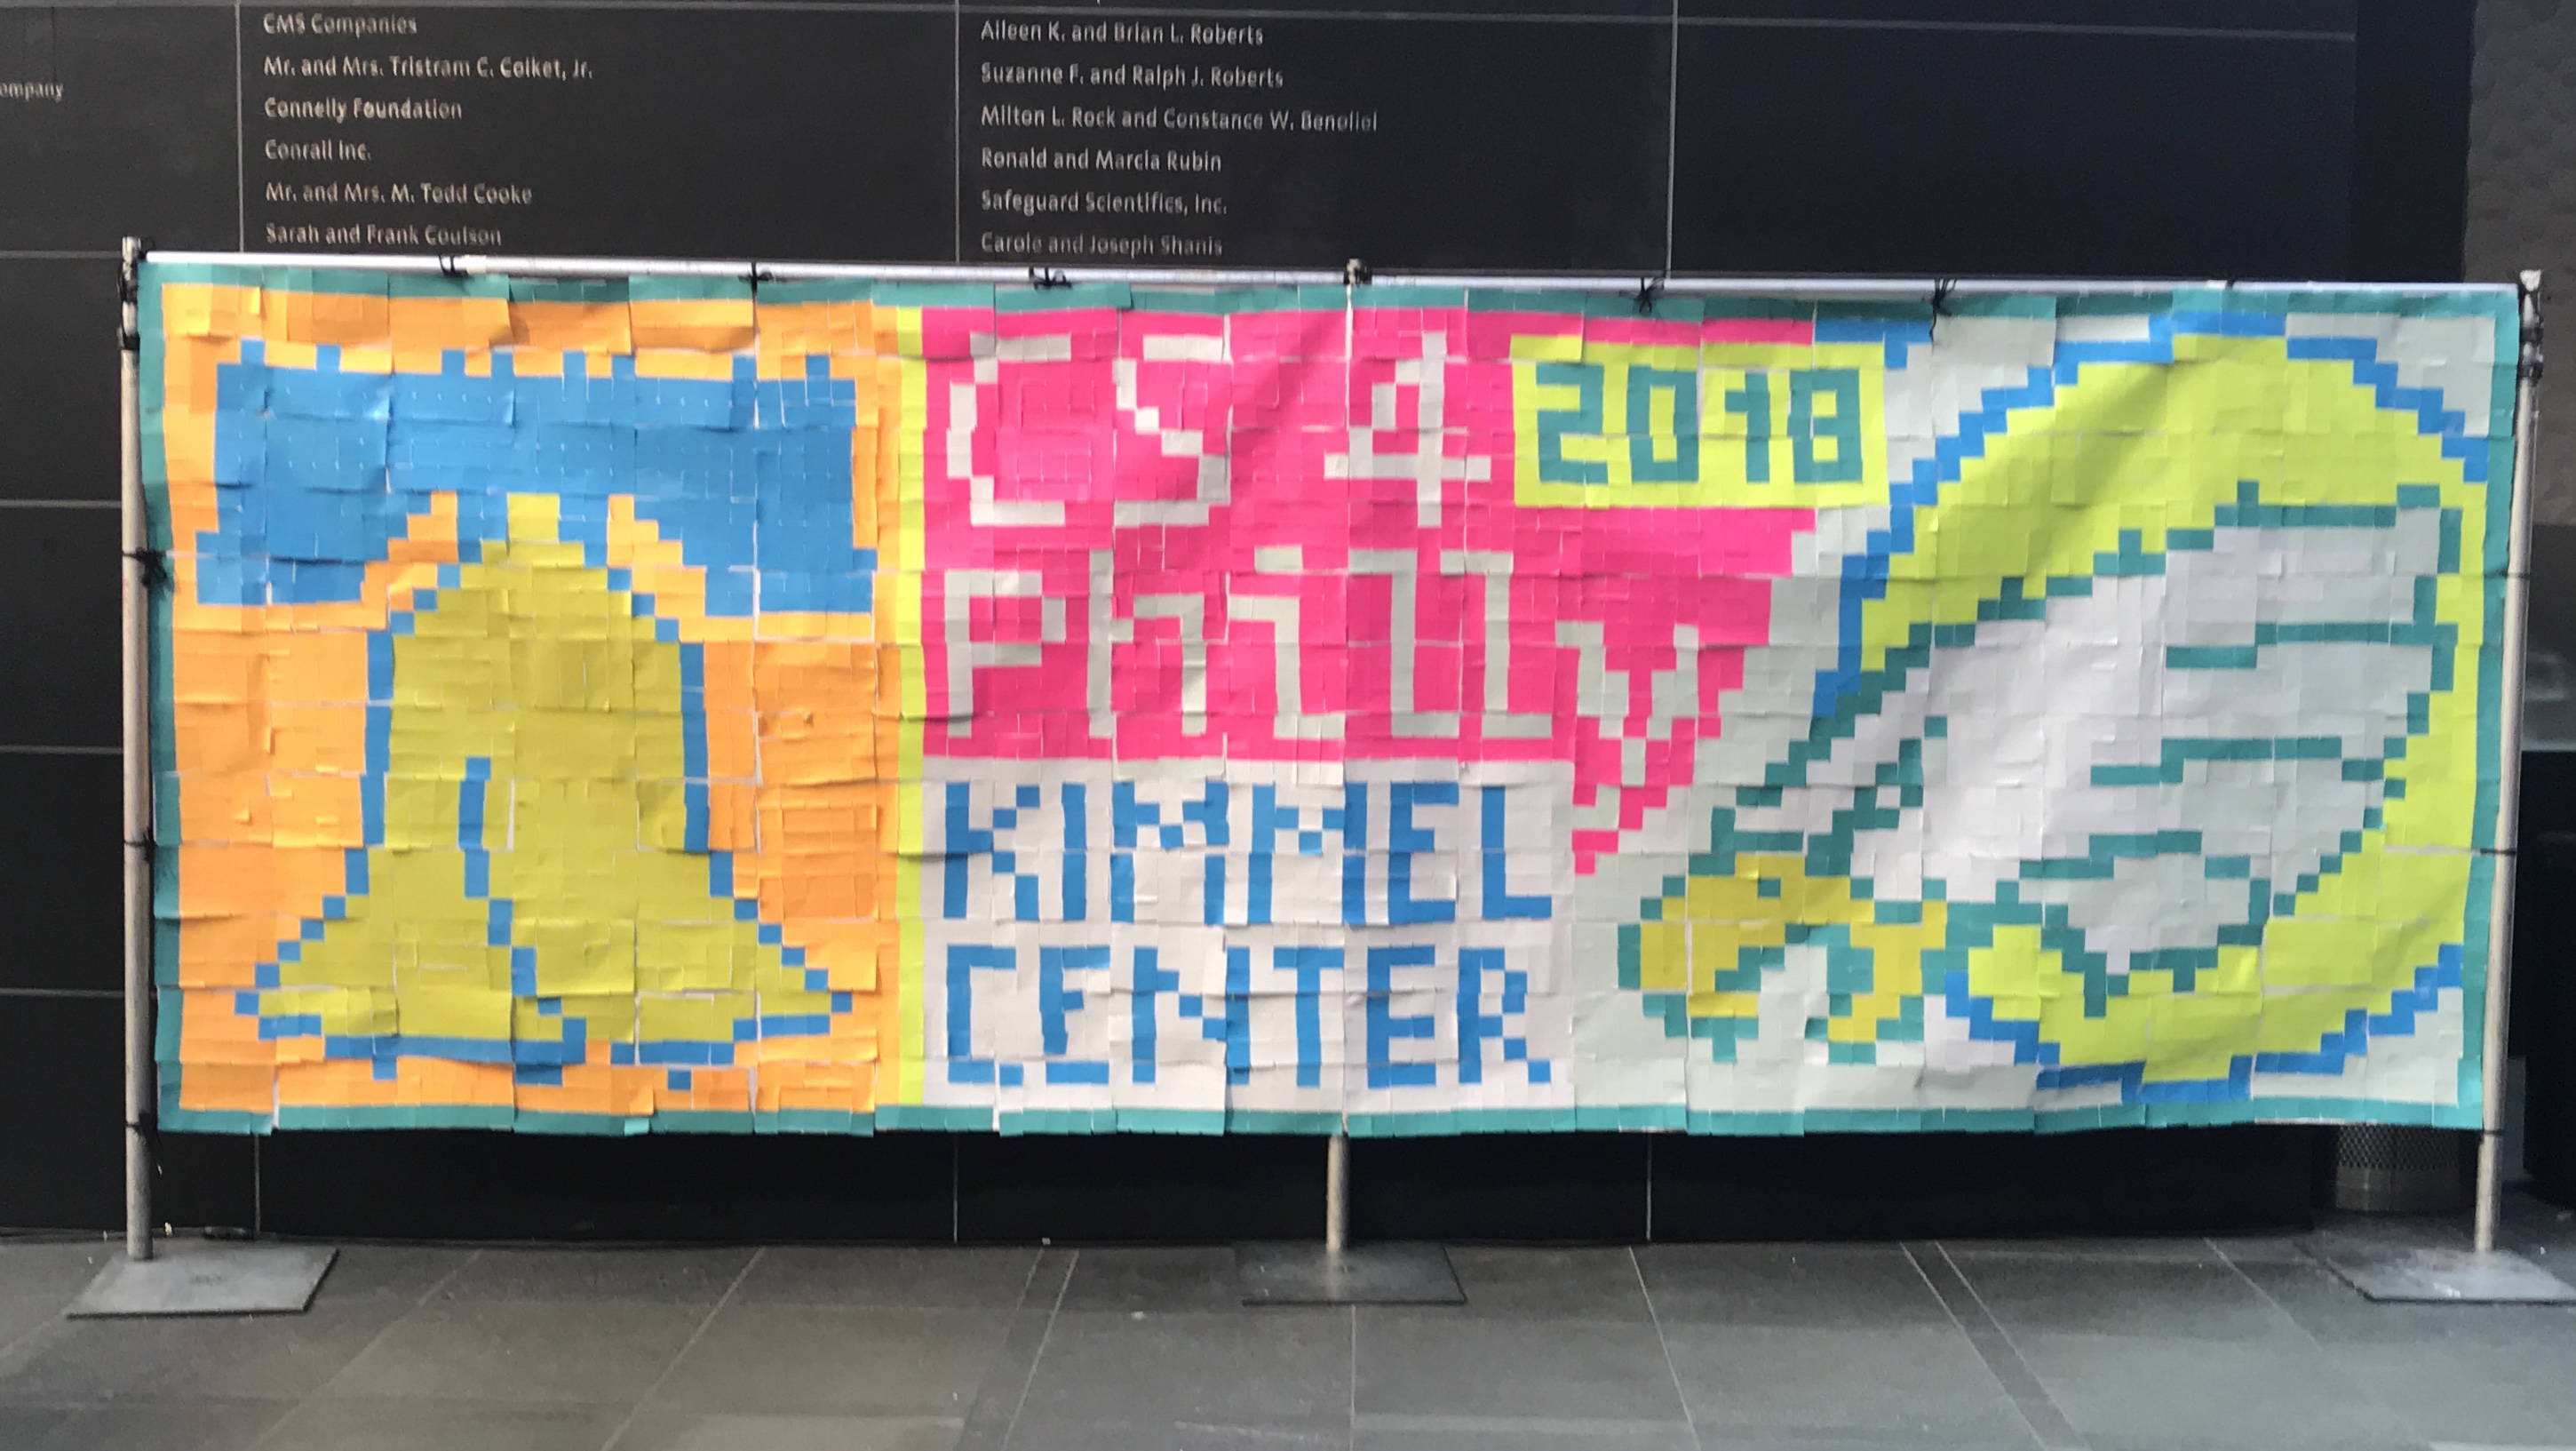
The Student CS Experience kicked off CS4Philly Week (https://www.csphilly.org/cs4philly-week-2018-1), during National Computer Science Education Week. CS4Philly is a member of the National CSforAll Consortium. See more pictures from the event here.
back to Table of Contents
How Can I Do This?
See Instructions for setting up and running this activity, including our Python program that produces converting an image to individual pages of codes. Sample output files can be found there.
back to Table of Contents
What Does This Have to do With Computer Science?
This exercise illustrates the following Computer Science Principles, classified as Enduring Understandings, Learning Objectives (What students must be able to do), Essential Knowledge (What students need to know), as outlined in [AP Computer Science Principles Curriculum Framework, 2016-2017].
Big Idea 1: Creativity
-
1.3.1 Use computing tools and techniques for creative expression. [P2]
-
1.3.1C Digital images can be created by generating pixel patterns, manipulating existing digital images, or combining images.
Big Idea 2: Abstraction
-
2.1.1C At a higher level, bits are grouped to represent abstractions, including but not limited to numbers, characters, and color.
-
2.2.3K Lower-level abstractions can be combined to make higher-level abstractions, such as short message services (SMS) or email messages, images, audio files, and videos.
Big Idea 3: Data and Information
-
Enduring Understandings
-
3.3 There are trade-offs when representing information as digital data.
-
Learning Objectives
-
3.3.1 Analyze how data representation, storage, security, and transmission of data involve computational manipulation of information. [P4]
-
Essential Knowledge
-
3.3.1A Digital data representations involve trade-offs related to storage, security, and privacy concerns.
-
3.3.1C There are trade-offs in using lossy and lossless compression techniques for storing and transmitting data.
-
3.3.1D Lossless data compression reduces the number of bits stored or transmitted but allows complete reconstruction of the original data.
-
3.3.1G Data is stored in many formats depending on its characteristics (e.g., size and intended use).
Big Idea 4: Algorithms
-
4.1.1H Different algorithms can be developed to solve the same problem.
-
4.2.4D Different correct algorithms for the same problem can have different efficiencies.
-
4.2.4E Sometimes more efficient algorithms are more complex.
-
4.2.4G Efficiency includes both execution time and memory usage.
Overall, this has always proved to be an enjoyable learning activity. There are always some students who get very excited about it. I would say that the appealing elements are similar to those experienced when playing Tetris.
Best wishes,
Jeffrey L. Popyack
Dept. of Computer Science
Drexel University
Philadelphia, PA 19104-2875
+1 (215) 895-1846
Popyack@Drexel.edu