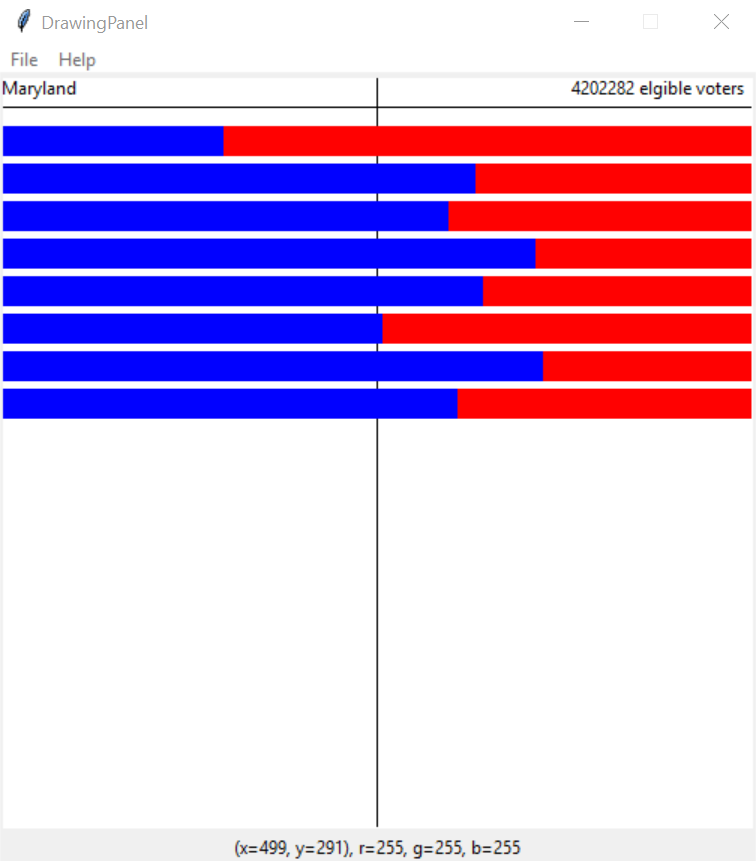
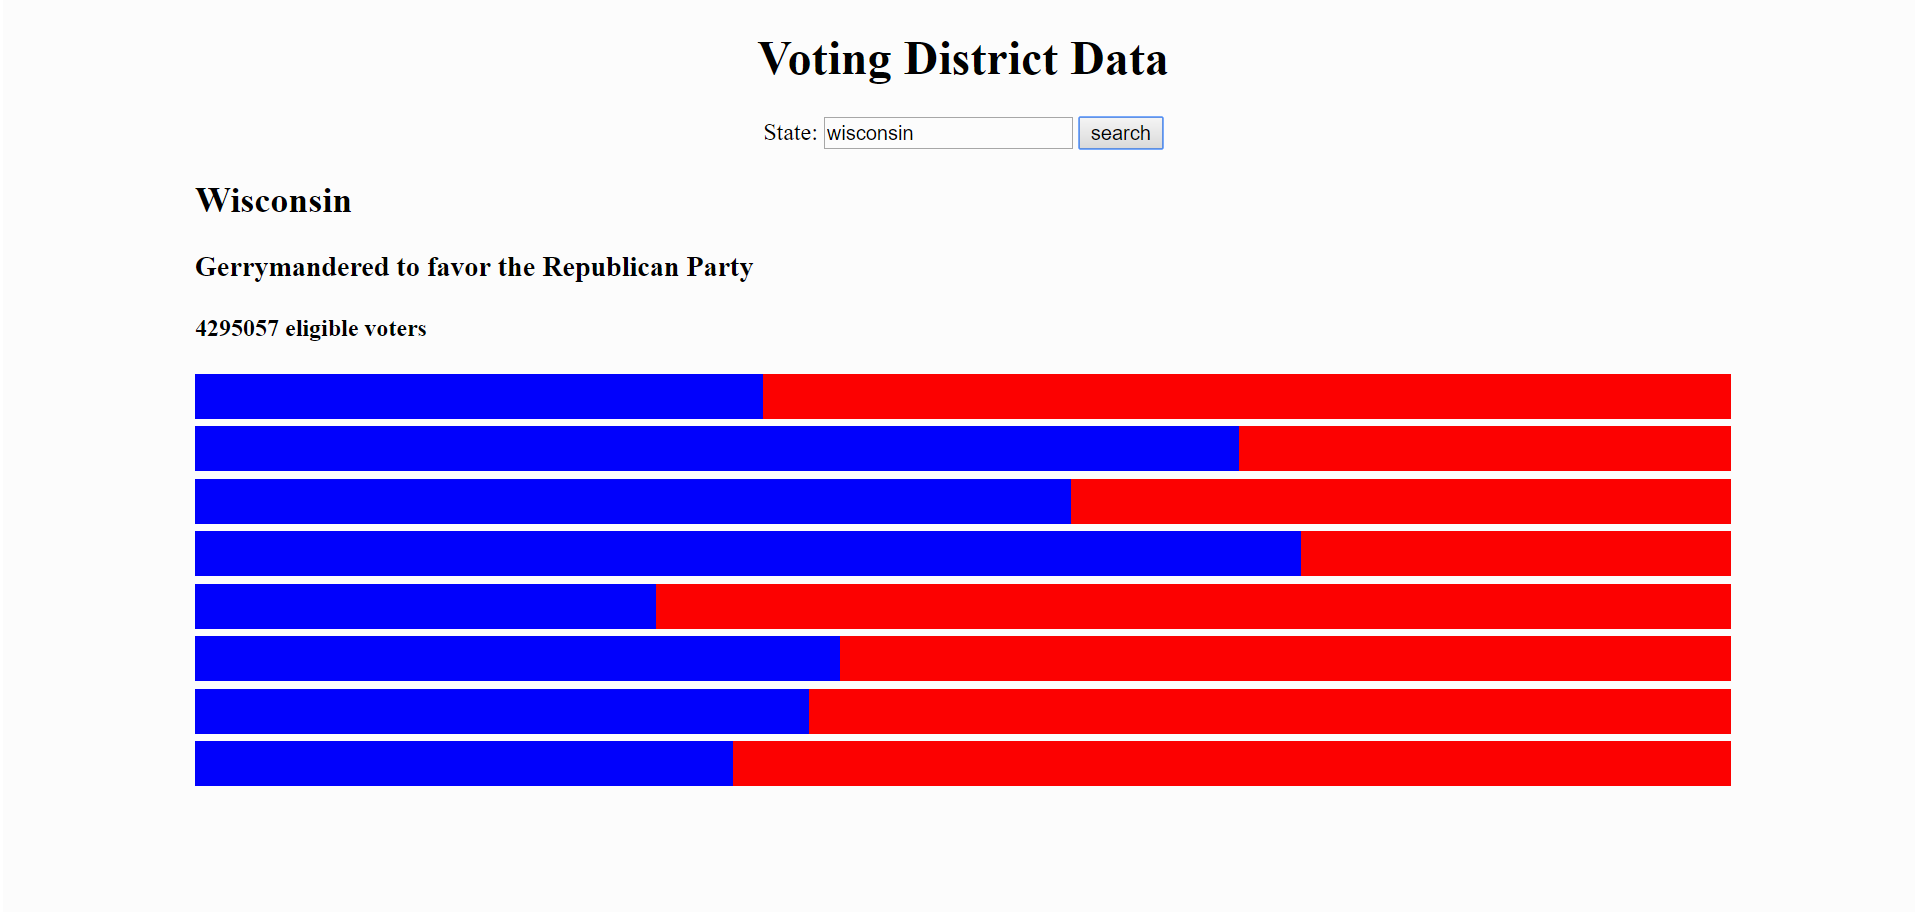
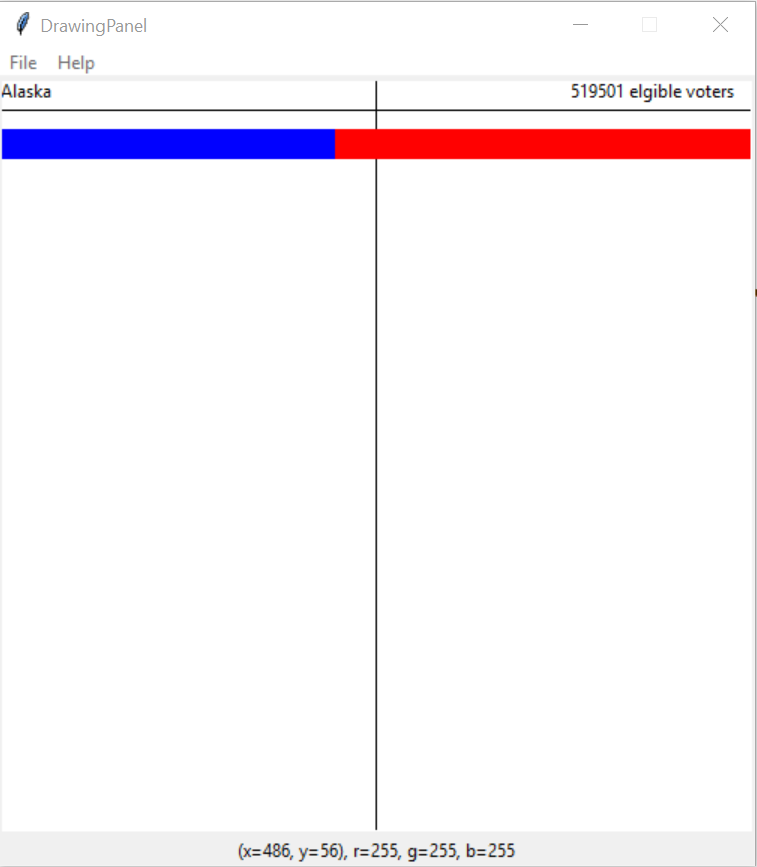
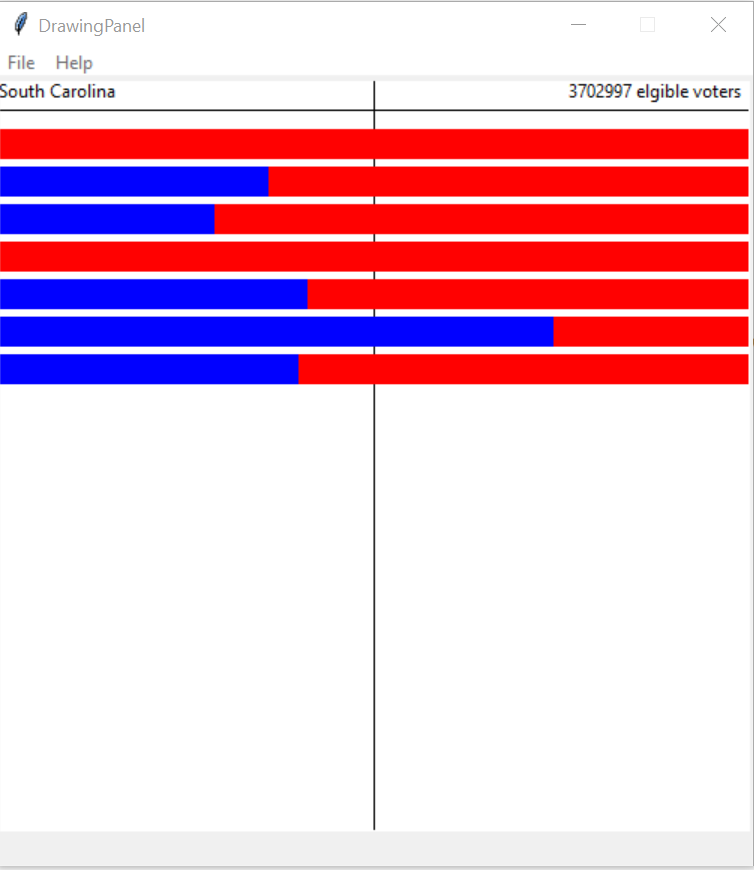
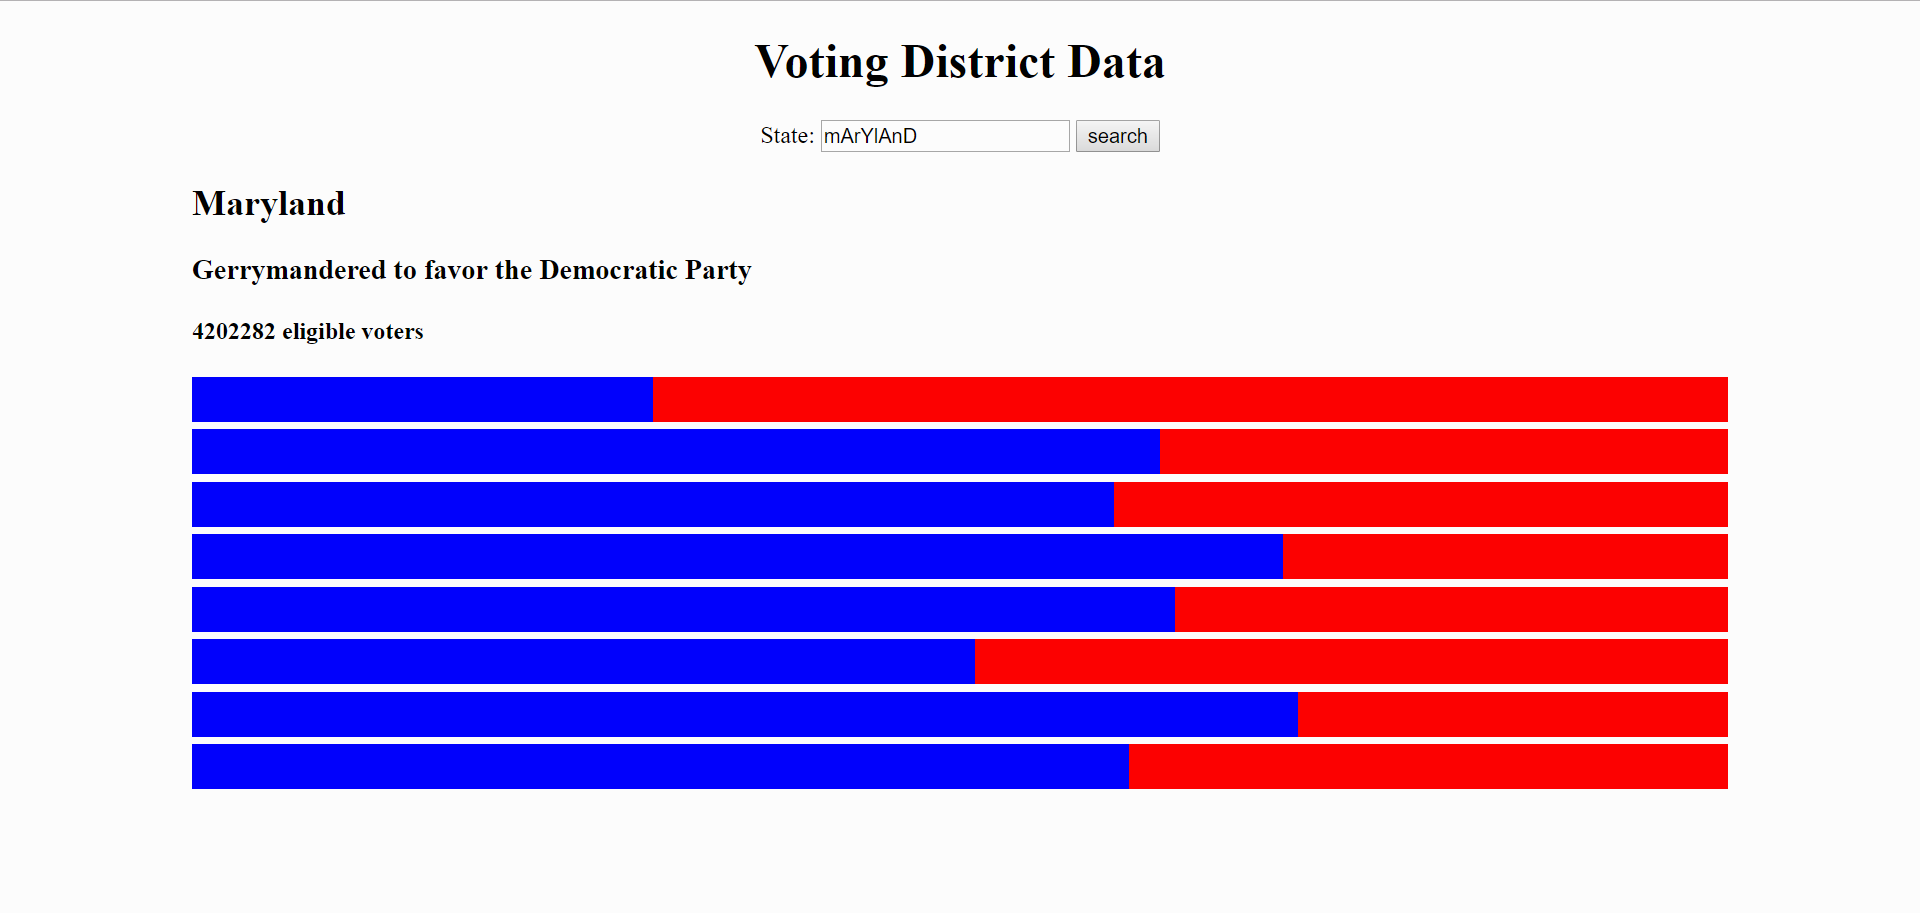
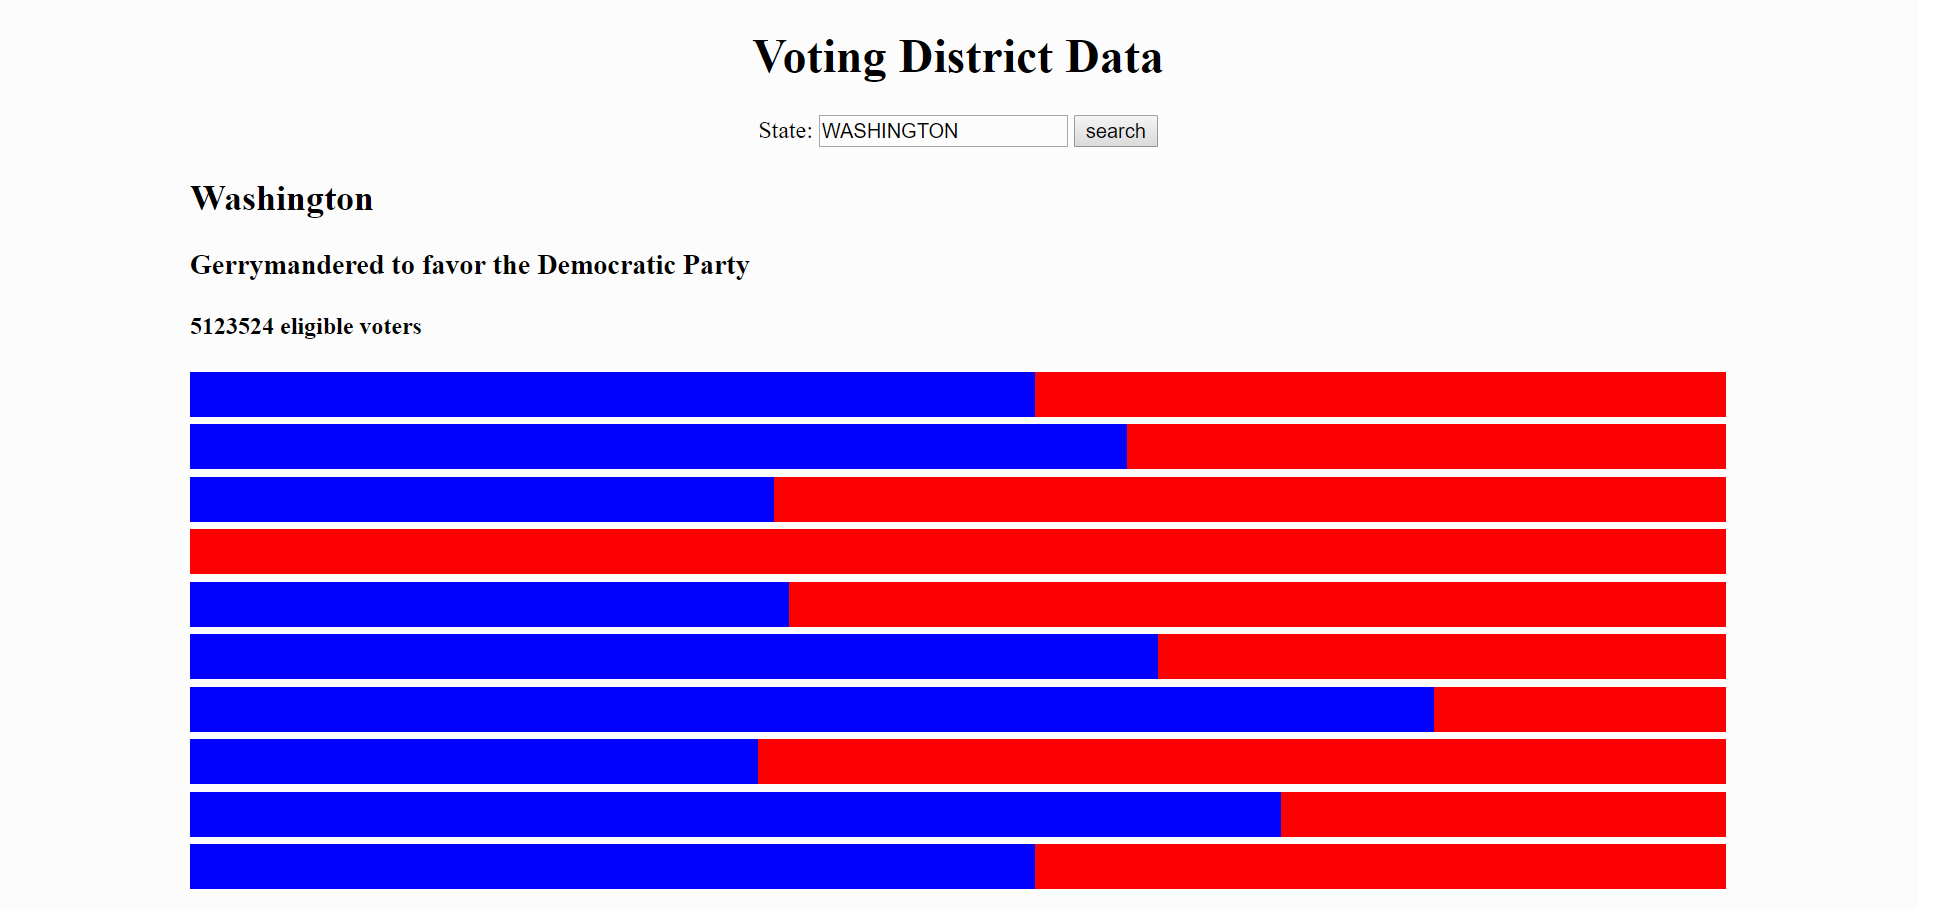
Gerrymandering is creating voting districts to give one party an unfair advantage. Students write a program to analyze voting data from a prior election and report whether a state exhibits evidence of having been gerrymandered according to a mathematical definition.
The core of this assignment is a straightforward calculation; the difficulty can be adjusted by changing how the results are visualized. This assignment has been given in a CS1 course taught in Python and a CS1.5 level web programming course.
The data used is interesting and real-world but yet still manageable to visualize and debug. Gerrymandering is topical and relevant for modern citizenship. The non-computer science learning that they do to complete this assignment provides student with deeper insight into the political process.
| Python version | Javascript version | |
|---|---|---|
| Provided Files: | ||
| Required Support Files: |
|
|
| Input Files: | ||
| Expected Output Files: |
| Python verison | JavaScript version | |
|---|---|---|
| Summary | In this assignment, students visualize voting districts and determine whether they are gerrymandered using a mathematical definition. This assignment gives students practice reading files (or fetching JSON data if done as a web assignment), processing strings and basic graphics. | |
| Topics | file reading, string manipulation, basic graphics | fetch, parsing JSON |
| Audience | Part way through a CS1 course. | |
| Difficulty | This is an intermediate CS1 assignment. Students were given 1 week to complete it. | This was given as an intermediate CS1.5 assignment. Students were given 1 week to complete it. |
| Dependencies | The DrawingPanel.py graphics library. | The gerrymandering_service.js Node.js web service. |
| Prerequisites | Requires no prior knowledge of gerrymandering or politics. Students need to know how to read and parse files, manipulate strings and do basic graphics. | Requires no prior knowledge of gerrymandering or politics. Students need to know how to use fetch and manipulate JSON data. |
| Strengths | It analyzes real-world data that is of concern to many at the moment and provides student with deeper insight into the political process. In doing so it demonstrates the relevance of CS to other fields and aspects of life. | |
| Weakenesses | This assignment may be felt to be be too political by some. It also may not work well in countries outside the United States. | |
| Variants | Besides the two variants presented here, you could alter this project in many ways. The visualization could be altered to display a map of the state with each district colored as in the Purple America assignment or displayed as a vertical bar graph as in the Name Surfer assignment. Web programming students could also be asked to write the web service. | |