Hurricane Tracker
Background
Living in South Florida for the past 12 years, I am no stranger to hurricanes. Last summer, I moved from South Florida to the Tampa area, only to have 2017 bring us a very active hurricane season including Tampa's first major hurricane in 96 years, Hurricane Irma. Thus was born the Hurricane Tracking assignment.
Overview
This assignment gives students an opportunity to work with loops, file io, and string manipulation in a graphical way. In this assignment students write a program that processes real-world hurricane data and animate the path of hurricanes.
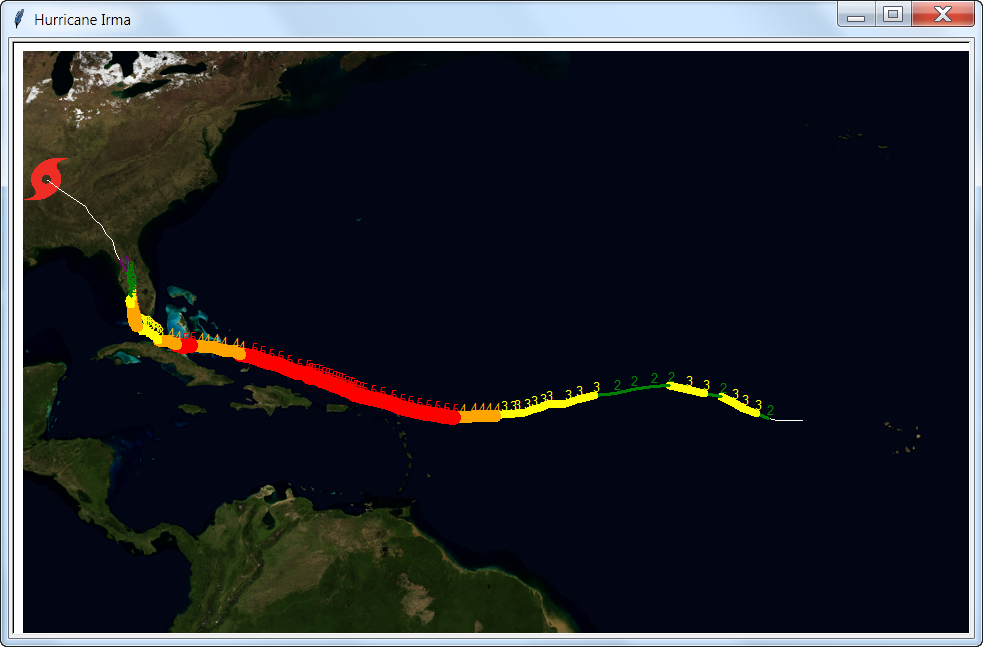
Students are given a number of files including an image file of the atlantic basin taken from NASA https://visibleearth.nasa.gov/view.php?id=74518 -- a scaled and cropped version of quadrant B1, CSV data files, and a Python file that sets up the turtle, the window and coordinate system.
The provided with CSV text files that contains 6 columns, date, time, latitude, longitude, wind speed in mph, and barometric pressure. Here are the first 3 lines of the irma.csv file. The data were scraped from Weather Underground's website, for example, https://www.wunderground.com/hurricane/atlantic/2017/hurricane-irma.
| Date | Time | Lat | Lon | Wind | Pressure |
|---|---|---|---|---|---|
| 30-Aug | 15:00 GMT | 16.4 | -30.3 | 50 | 1004 |
| 30-Aug | 21:00 GMT | 16.4 | -31.2 | 60 | 1001 |
The students must write the code that animates the path of the hurricane along its track, marking on the map the category of the storm at each point.
Demos
Python turtle version
Javascript/Google Maps API version
Assignment Materials
Metadata
| Summary | Students develop a program to visualize the track of a single or multiple hurricanes. |
| Topics | Selection, looping, file io, string processing/manipulation, and graphics. |
| Audience | Appropriate for CS1 students familar with selection, loops, file io, strings, and graphics. The supplied materials are written in Python. |
| Difficulty | This assignment is appropriate for a CS1 class given a week. |
| Strengths |
|
| Weaknesses |
|
| Dependencies |
|
| Variants |
|