Author: Ben Stephenson (ben.stephenson@ucalgary.ca)
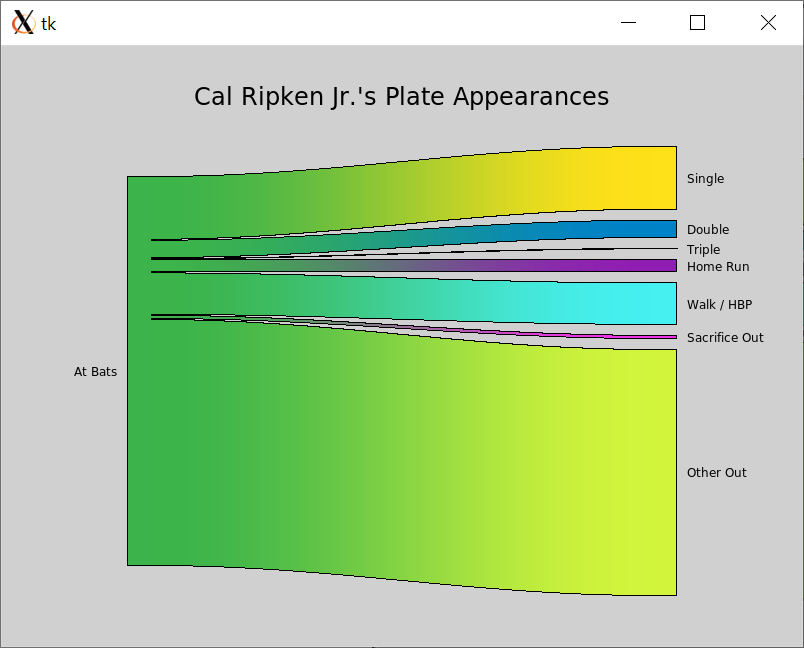
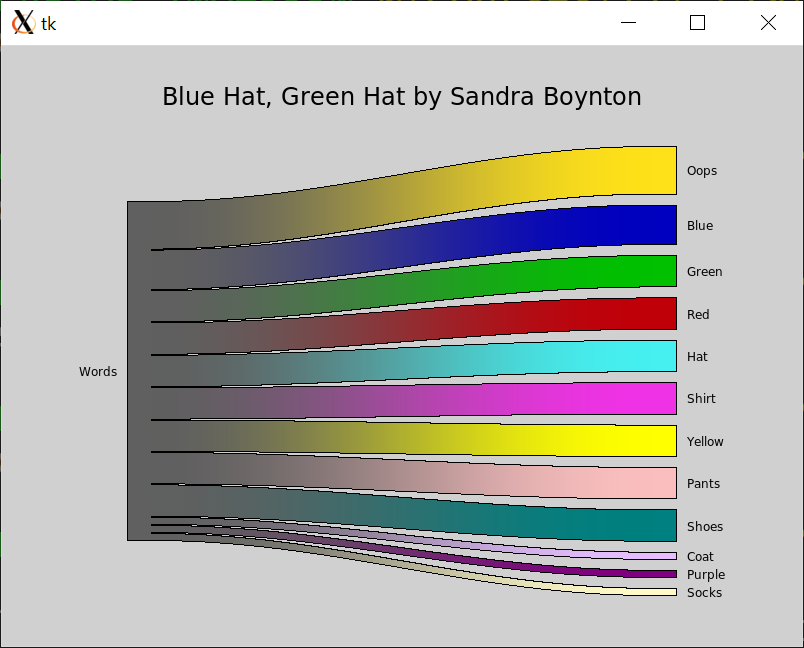
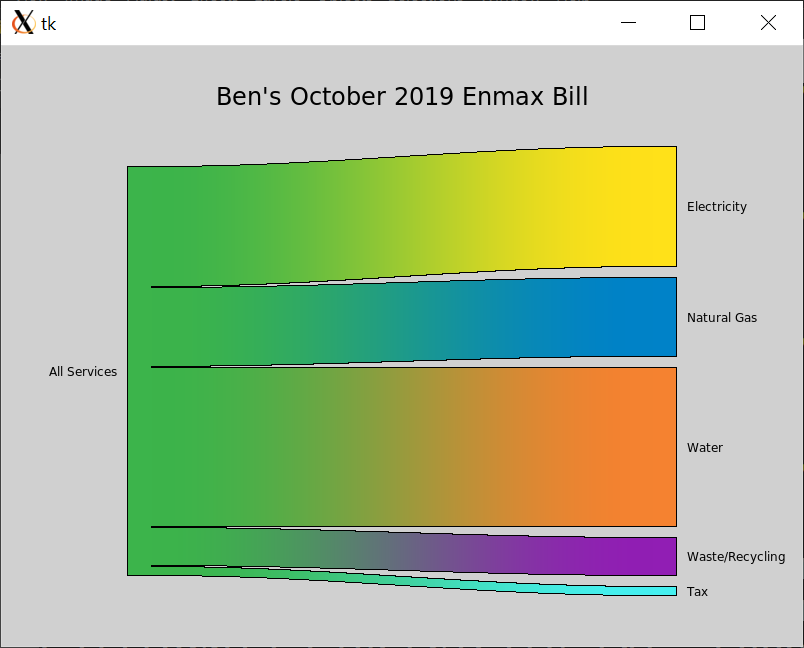
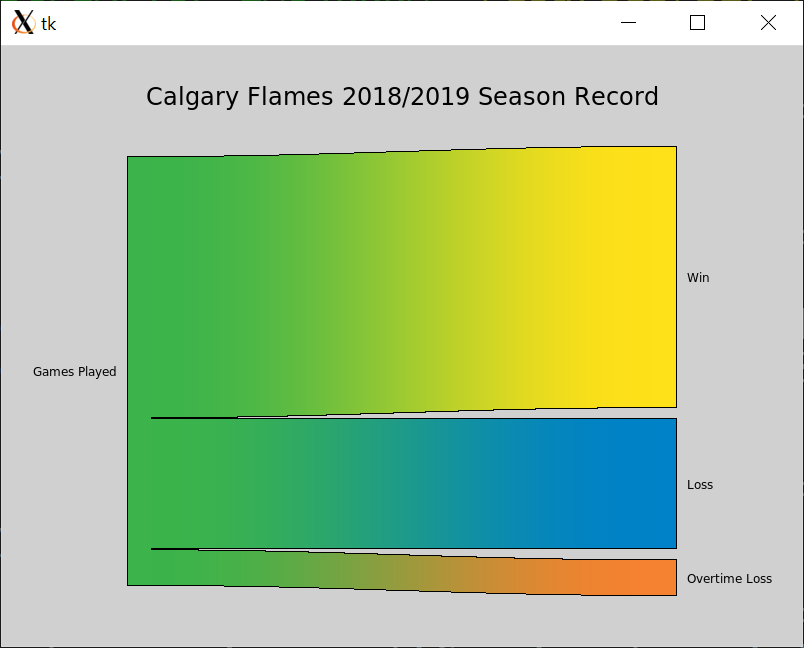
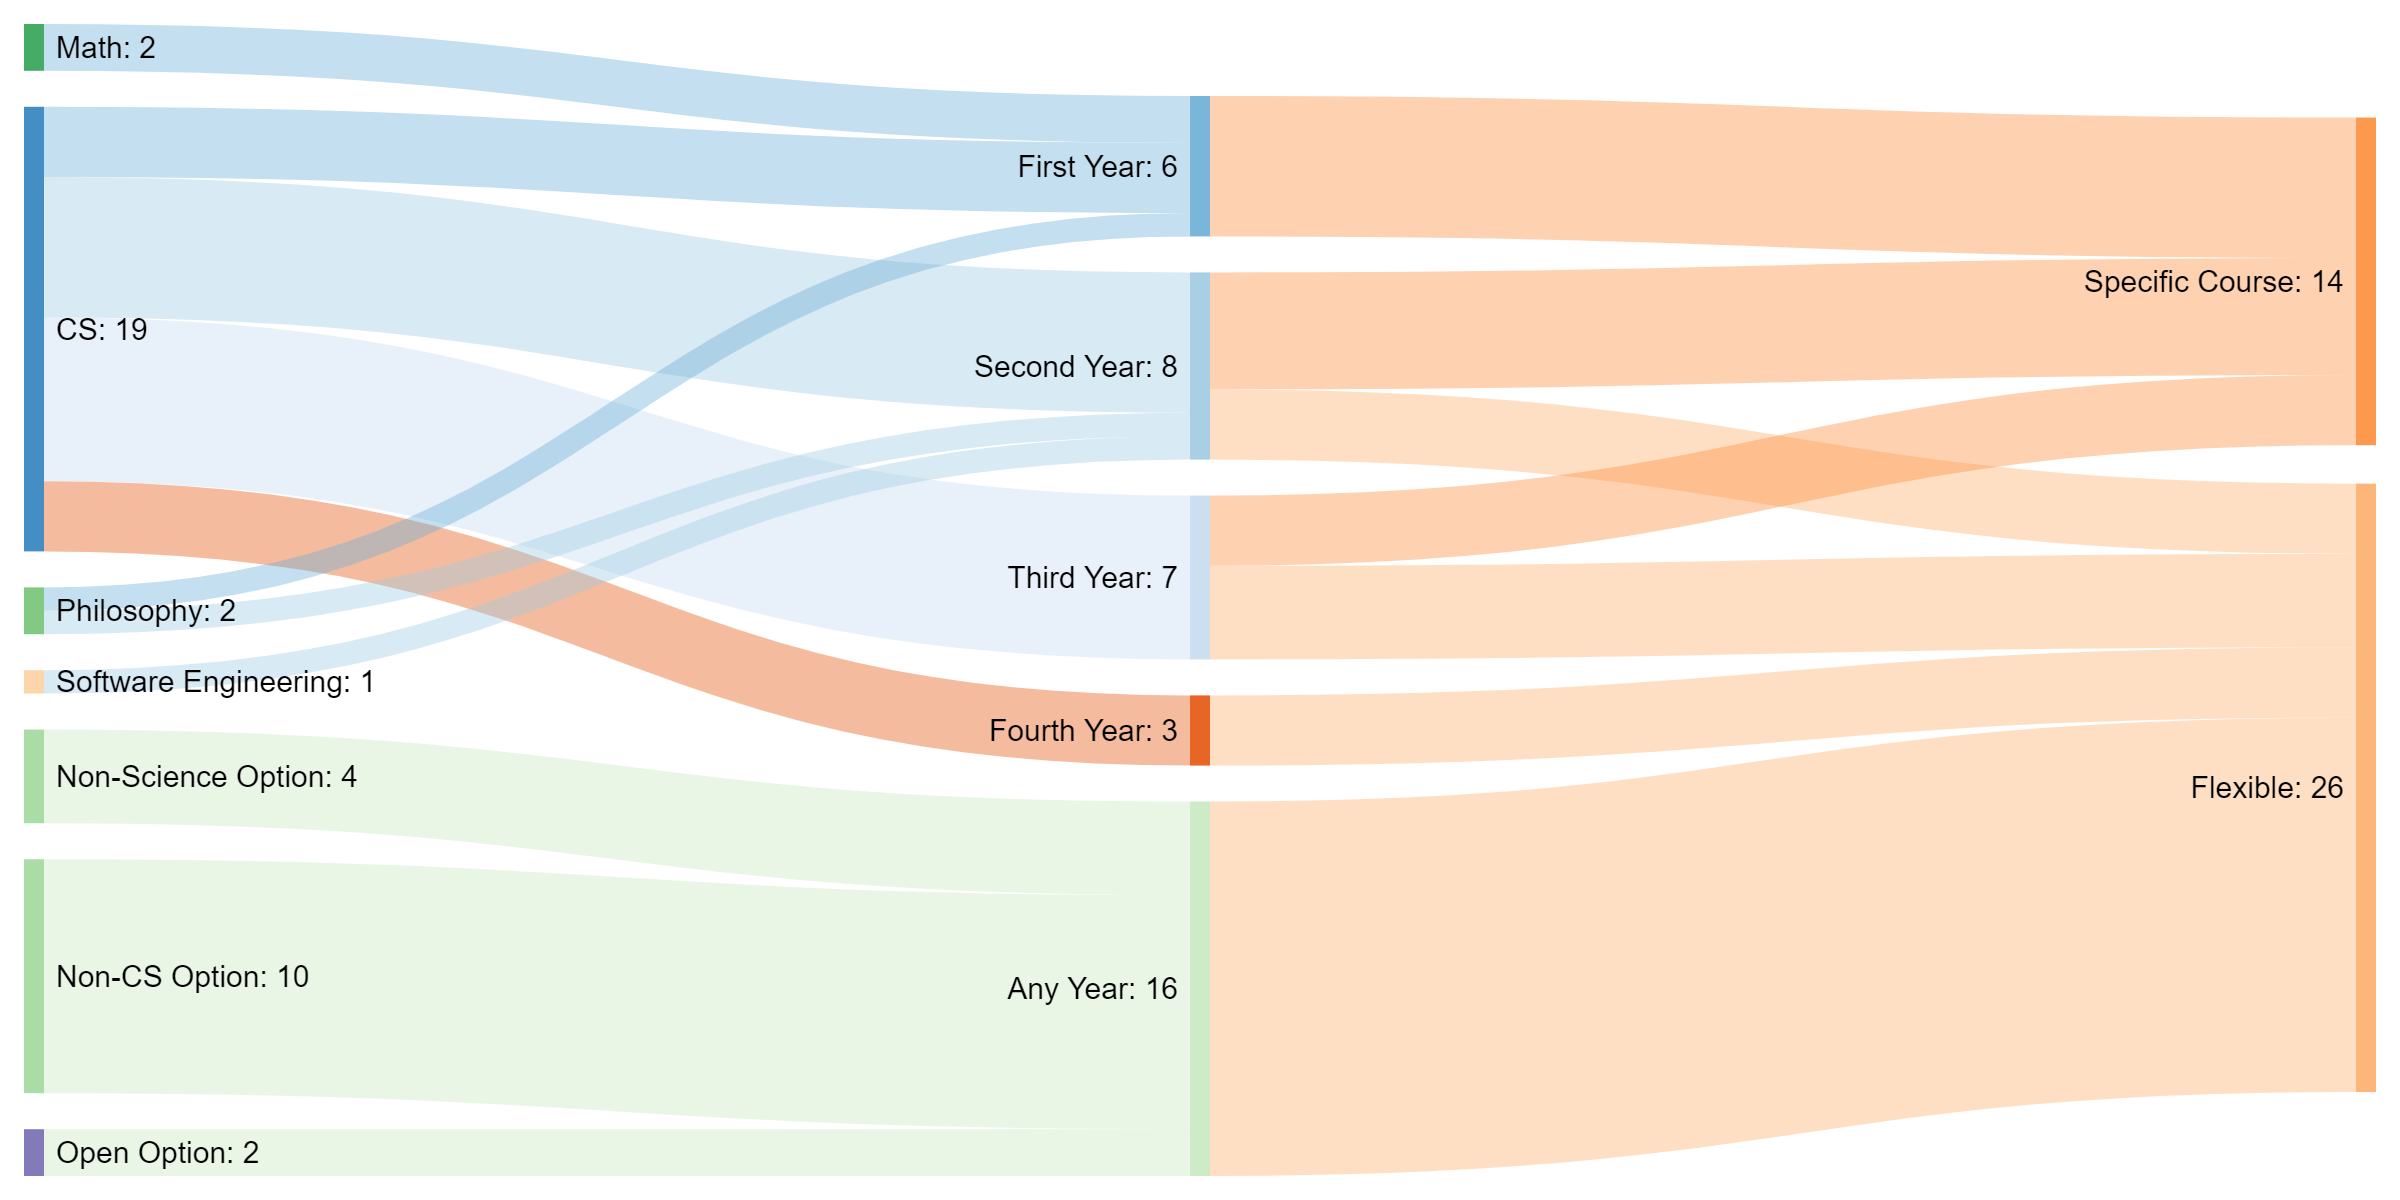
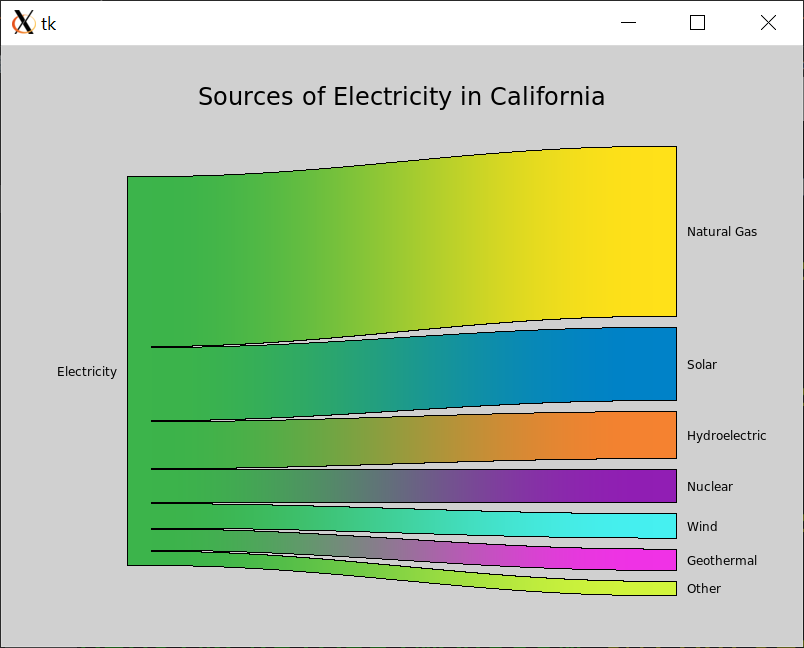
A variation of a Sankey diagram can be used to show how a source value is split into different destination components or how a whole quantity is divided into parts. For example, the diagram above shows the sources of power consumed in California, with the widths of the bars showing how much power was consumed from each source. More complex variations of Sankey diagrams are capable of describing multi-level mappings and many-to-many mappings. An example of a many-to-many mapping can be found toward the bottom of this document along with a Sankey diagram that illustrate a relationship that is both multi-level and many-to-many.
I used this assignment with approximately 350 students enrolled in a CS1 course (for non-CS majors) in the fall of 2019. This is the actual student handout from that term: PDF Word
| Summary | This assignment asks students to create a program which visualizes data read from a file by drawing a variation of a Sankey diagram. The diagram shows how a source value is spread across multiple destinations, or how a whole quantity is divided into parts. |
| Audience | I used this assignment as the final assignment in a programming intensive CS1 course (for non-majors) that takes an objects-late approach. It can be used whenever students are being introduced to file I/O and have previous experience with dictionaries, lists, strings and functions. In my opinion this assignment was particularly well suited to the non-majors that my course focused on because it demonstrated how programming could be used as a tool to perform data analysis / visualization that isn't possible using Excel. |
| Difficulty | Students found this assignment to be moderately difficult. The assignment was constructed to walk students through the major steps needed to draw the diagram so that they could focus on the details of their implementations rather than identifying the higher level steps needed to solve the problem. I gave the students between 2 and 3 weeks to complete the assignment and my impression was that this was appropriate. |
| Topics | The assignment focuses on file I/O and dictionaries, and to a lesser extent, lists, strings and functions. Students also need to write loops and if statements which I assume they are comfortable with from prior assignments that focused on such. |
| Strengths |
Students achieve a rudimentary visualization quite quickly and then
invest additional effort to improve it. There is a substantial sense
of accomplishment as each part of the assignment is completed because
the visualization improves significantly as new features are added.
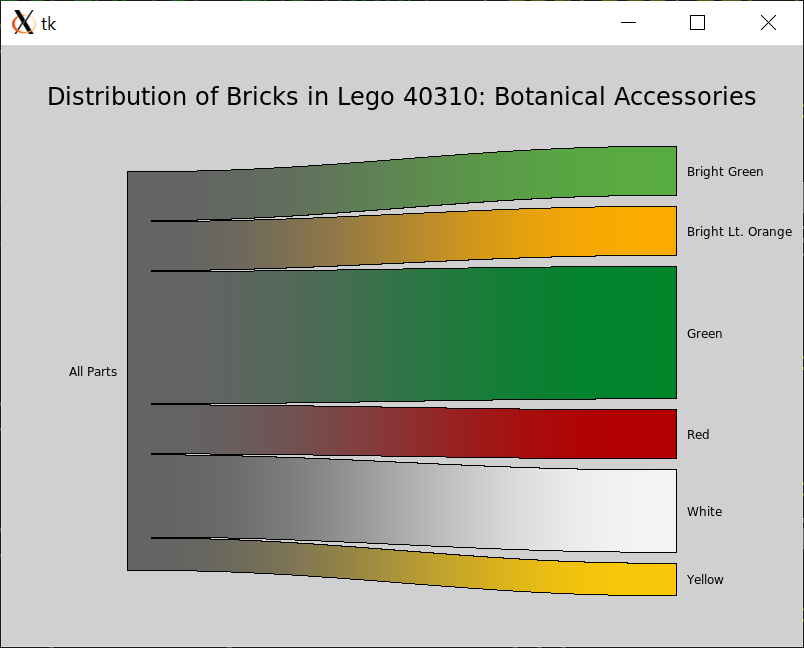
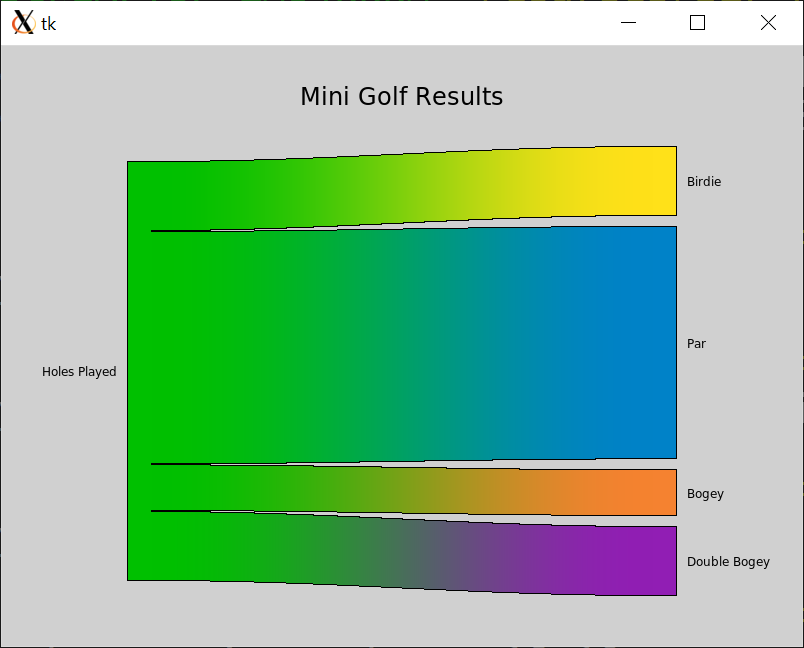
The final product is a visualization that cannot be constructed in Excel and can be applied to data of interest to the students. I provided several data sets from diverse fields for the students to work with so that they could select data that was of interest to them while working on the assignment and new data sets are easy to create. I believe that this was particularly valuable to the students in my course (who are all non-CS majors) because it demonstrated how computer programming could be used as a tool to assist them with working with data in their primary area of student. |
| Weaknesses | The assignment is rather linear, requiring students to complete earlier steps in the construction of the diagram before later steps can be completed. |
| Dependencies |
Because the output is graphical students need the ability to draw
graphics primitives such as lines, text, and ideally polygons.
While I used my own SimpleGraphics
module for such any graphics module that provides such primitives
could be used.
My students created their solutions in Python. However this assignment could easily be adapted to Java (or any other language used to teach CS1). |
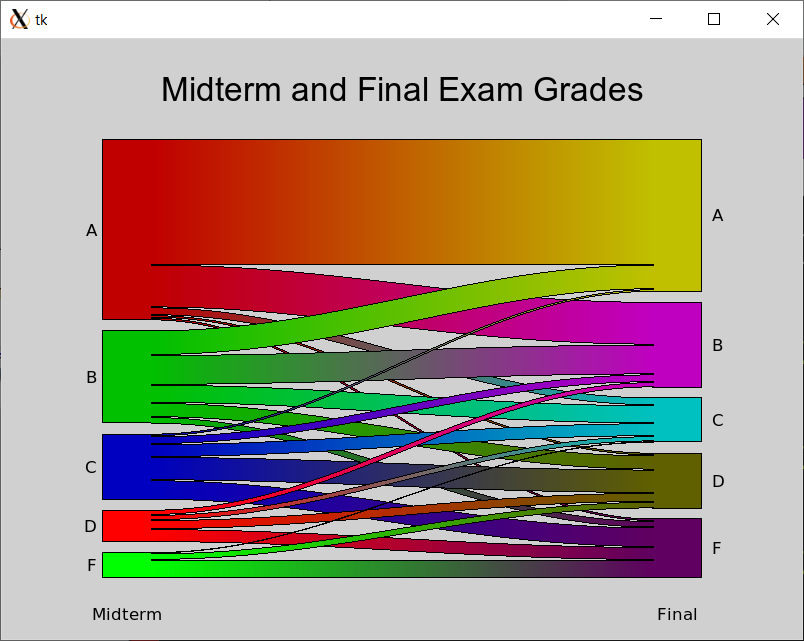
| Variants | My students were asked to construct a simple variant of a Sankey diagram that maps a single source to multiple destinations. A more complex variation of this assignment could be constructed that asks students to create either a multi-level Sankey diagram or a Sankey diagram which shows the mapping from several sources to several destinations. Both of these variations were going to be too much for my CS1 students to handle in the time available and would be more appropriate in CS2 or perhaps even an introductory data structures course. (A multi-level Sankey diagram where all of the destinations are distinct is naturally represented with a tree). An example image for a many-to-many Sankey diagram can be found later in this document, as can a Sankey diagram that is both multi-level and many-to-many that was generated with the online tool at Sankeymatic.com. Many additional examples of both multi-level and many-to-many Sankey diagrams can be found online. |