Write a program to visualize U.S. presidential election results.
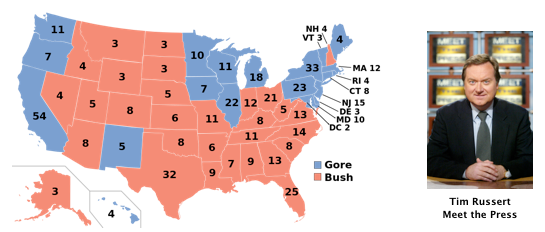
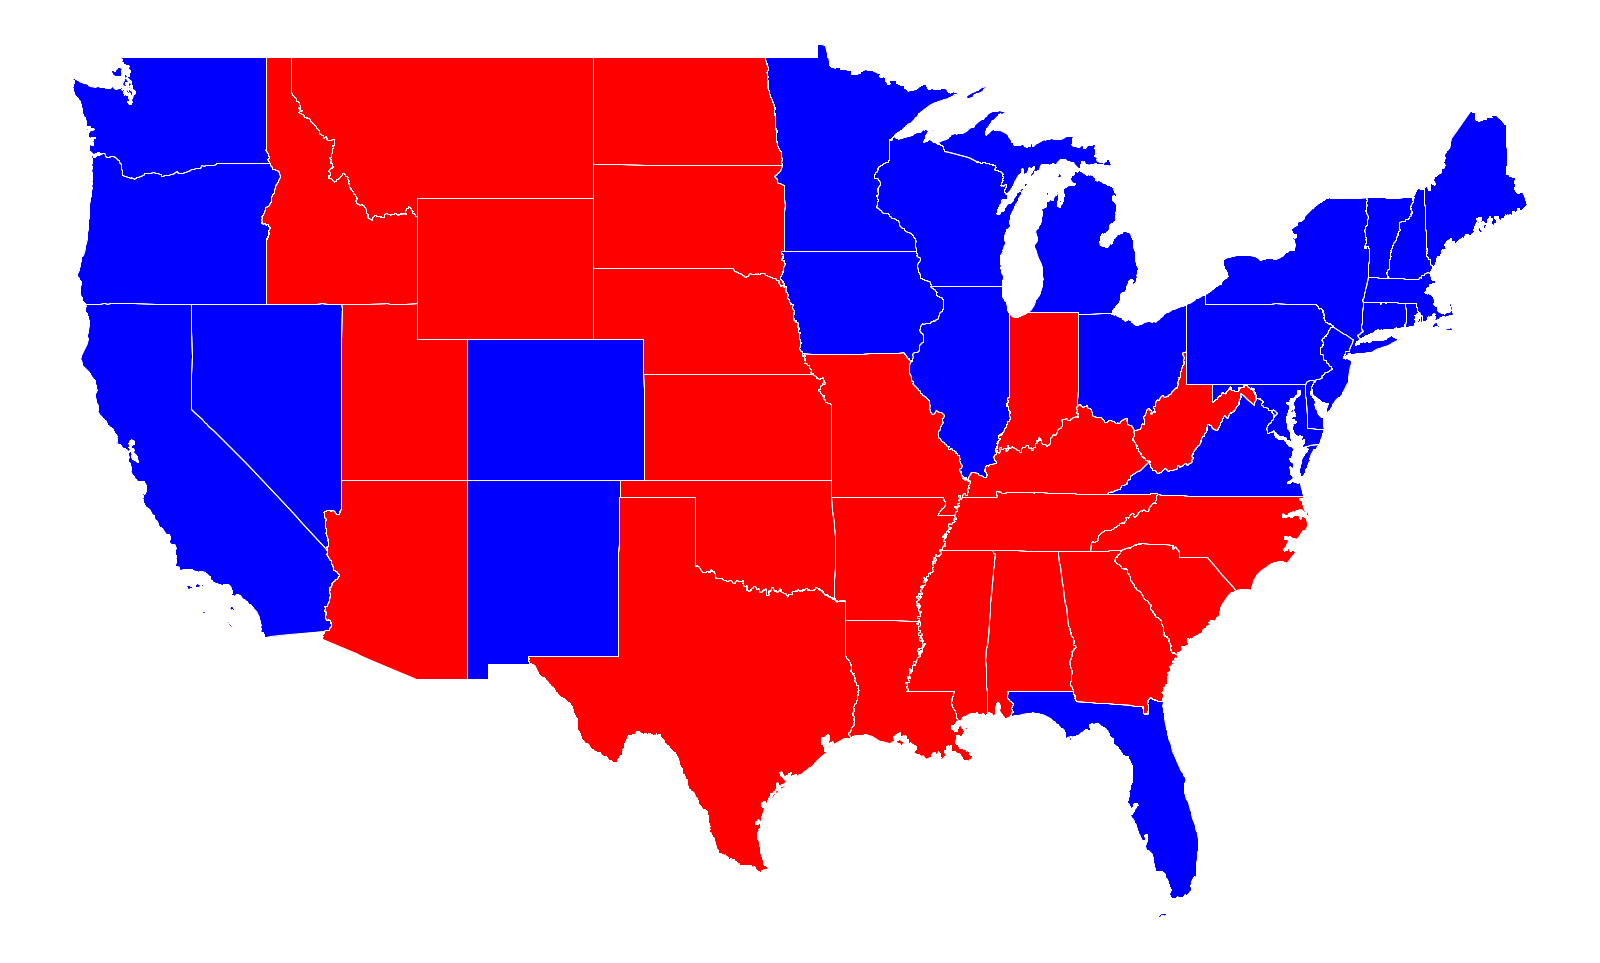
Historical context. During coverage of the 2000 presidential election, Tim Russert coined the political terms red states and blue states to refer to states that predominantly vote for the Republican presidential candidate (red) or the Democratic presidential candidate (blue). The news media use red-state blue-state maps, such as the one below, to display election results.
The problem. On this assignment, you will create more refined (and less polarizing) choropleth maps by mashing up two sources of data: geographic boundary data and election return data.
Geographic data. We supply geographic data (sourced from the U.S. Census) that describes the boundary of each state and county in the United States.
% more USA.txt -124.731216 24.544102 -66.980385 49.384365 104 Alabama USA 498 -88.200027 34.995548 -88.202919 35.007942 -87.984886 35.005848 ... -88.153519 34.921185 -88.176064 34.962433 -88.187088 34.974182 ... Wyoming USA 68 -111.048203 44.474144 -111.054558 44.666336 -111.054420 45.001392 ... -111.043846 43.315800 -111.044724 43.501213 -111.046272 43.983456 |
% more NJ.txt -75.560143 38.928589 -73.894402 41.357330 21 Atlantic NJ 127 -74.877563 39.608414 -74.736694 39.729721 -74.676102 39.691162 ... -74.857353 39.420528 -74.856087 39.424465 -74.985443 39.514725 ... Warren NJ 121 -75.120819 40.968208 -75.122986 40.970055 -75.131744 40.969185 ... -75.095901 40.924057 -75.112061 40.948017 -75.118141 40.952927 |
% more USA-county.txt -124.731216 24.544102 -66.980385 49.384365 3206 Autauga AL 118 -86.916969 32.664028 -86.816589 32.659988 -86.713409 32.661602 ... -86.916809 32.649662 -86.917458 32.653877 -86.921387 32.655415 ... Weston WY 11 -105.078743 44.176205 -104.375000 44.181641 -104.054001 44.180401 ... -105.081238 43.592144 -105.078255 43.827049 -105.080872 43.826954 |
Election return data. We supply election return data (sourced from Dave Leip's Atlas of U.S. Presidential Elections) that describes the results for each presidential election, by state and county. Each row consists of four fields, separated by commas: the name of a subregion, the number of votes for the Republican candidate, the number of votes for the Democratic candidate, and the number of votes for the Independent (or third party) candidate.
% more USA2012.txt Alabama,1255925,795696,22717, Alaska,164676,122640,13179, Arizona,1233654,1025232,47673, Arkansas,647744,394409,27315, California,4839958,7854285,360745, ... Virginia,1822522,1971820,60147, Washington,1290670,1755396,99892, West Virginia,417655,238269,14743, Wisconsin,1407966,1620985,39483, Wyoming,170962,69286,8813, |
% more NJ2012.txt Atlantic,46522,65600,1222, Bergen,169070,212754,4166, Burlington,87401,126377,2561, Camden,69476,153682,2791, Cape May,25781,21657,655, ... Salem,14334,14719,570, Somerset,66603,74592,1985, Sussex,40625,26104,1465, Union,68314,139752,2022, Warren,25744,18745,926, |
You can download all of the geometric and election return data files collectively as purple-america-data.zip.
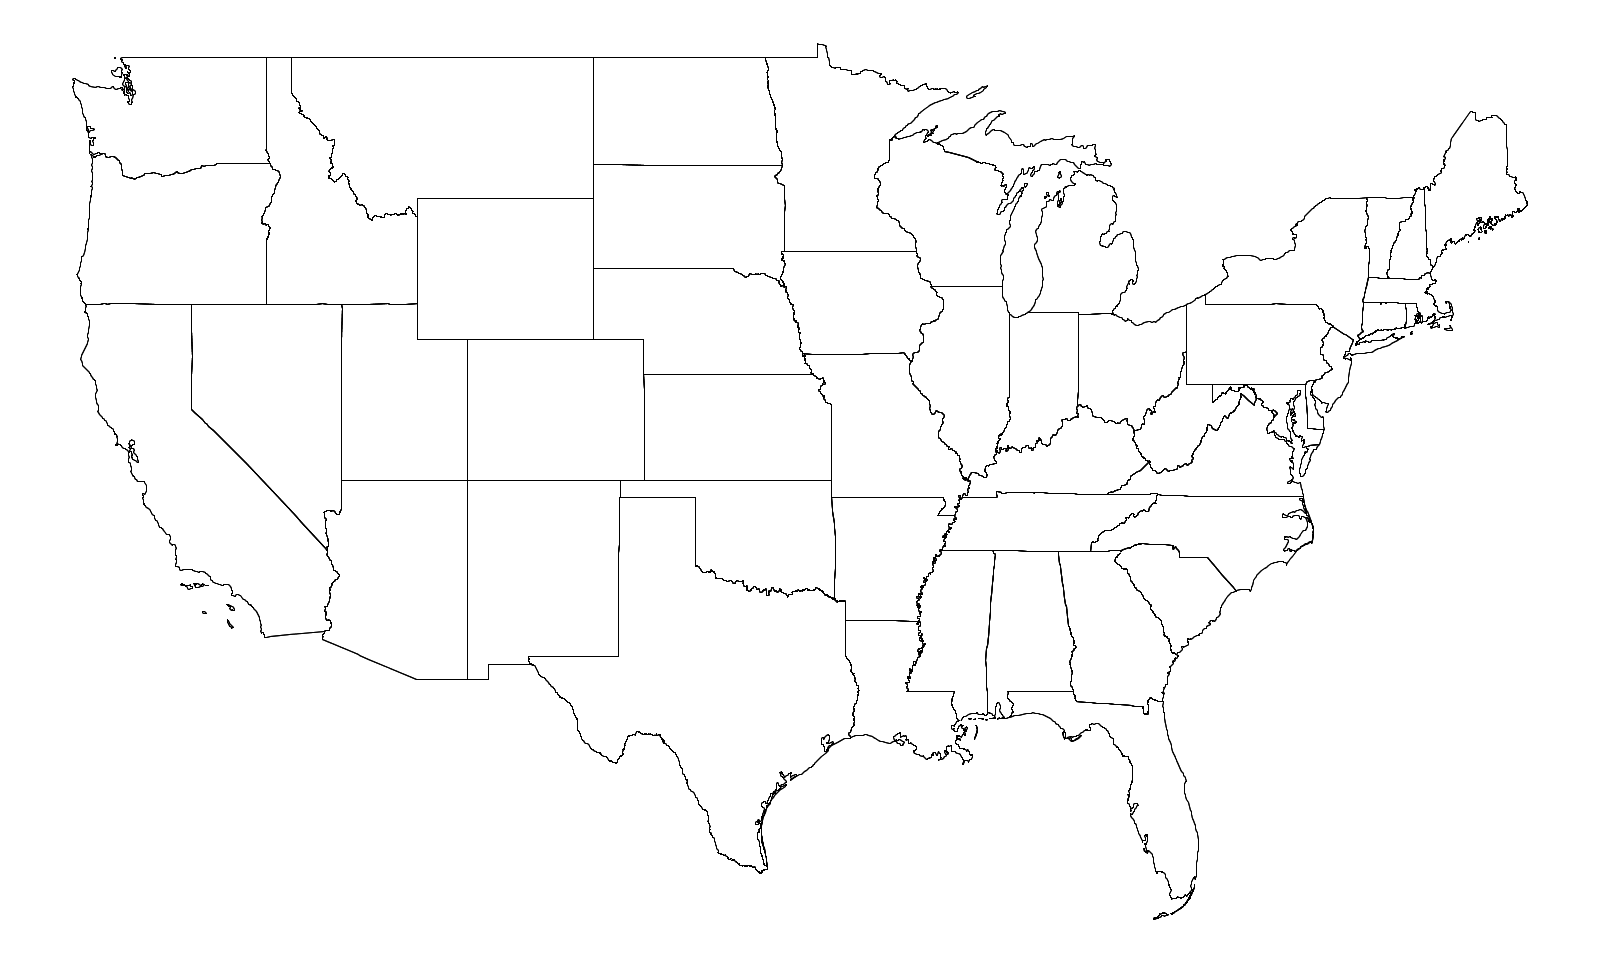
Part 1. Write a program White.java that takes the name of a region as the command-line argument and produces an outline map, as in the examples below:
% java White USA |
% java White NJ 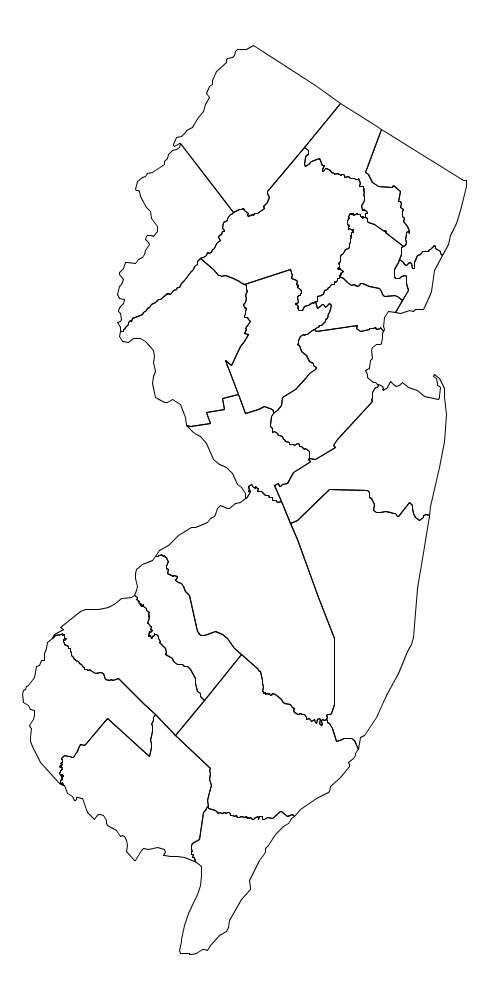
|
% java White USA-county 
|
For simplicity, draw the point with longitude x and latitude y at location (x, y) in the plane. Use the bounding box of the region to determine the part of the plane to display in the drawing window and rescale the coordinates accordingly.
Part 2. Write a program RedBlue.java that takes two command-line arguments (the name of the region and the year of the election) and produces a red-state blue-state map, as in the examples below:
% java RedBlue USA 2012 |
% java RedBlue NJ 2012 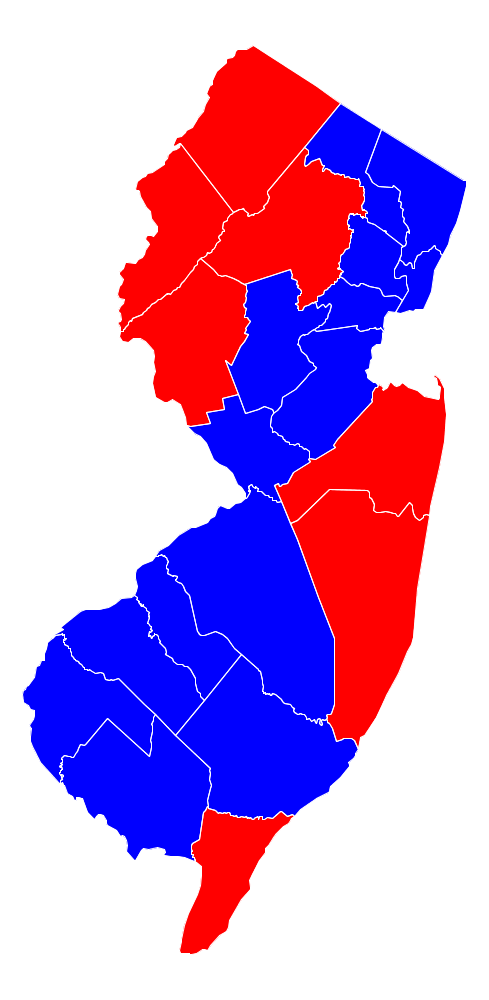
|
% java RedBlue USA-county 2012 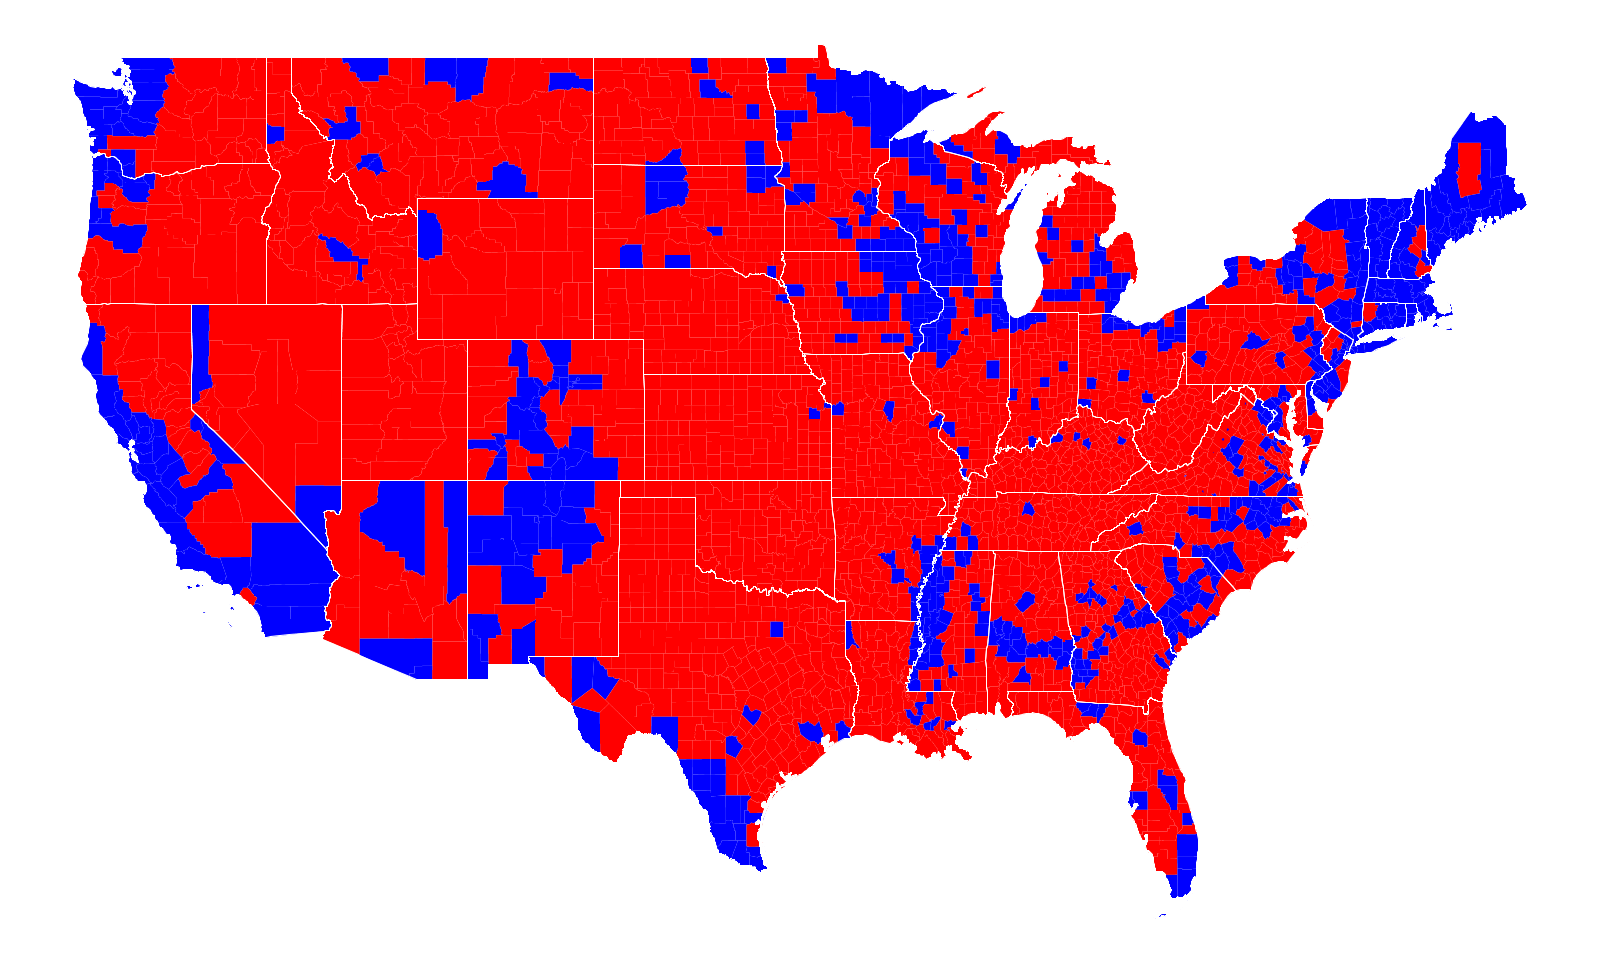
|
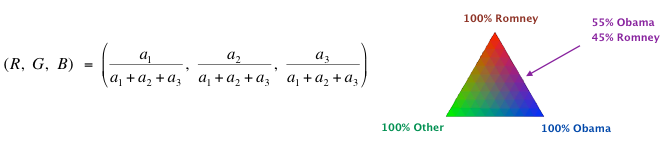
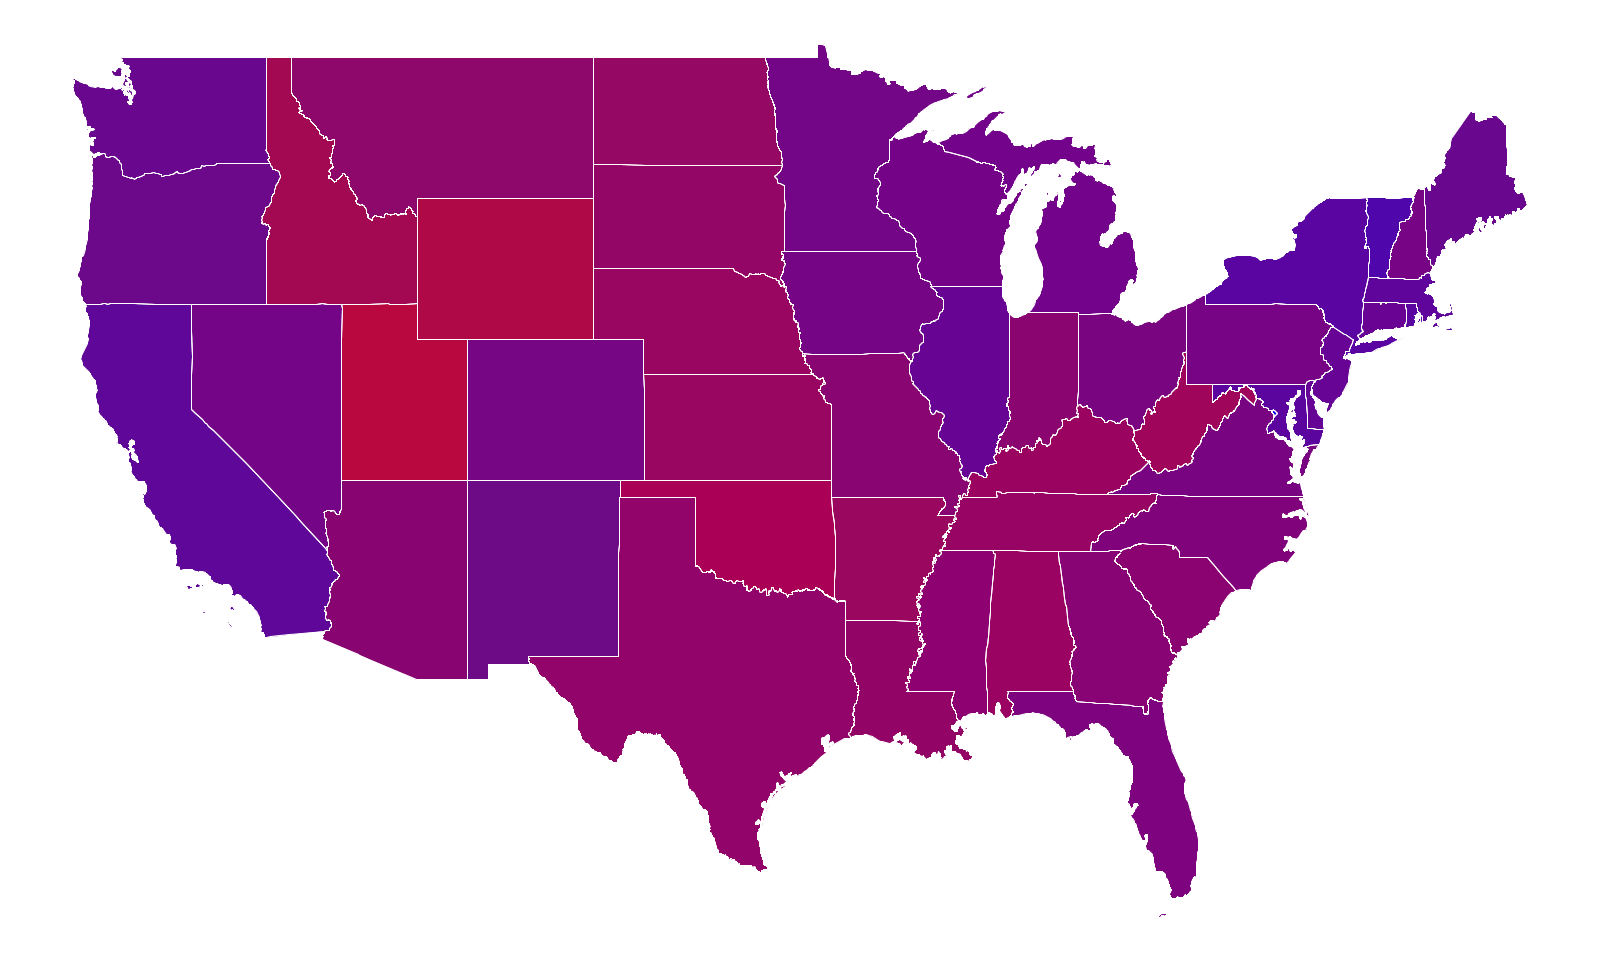
Part 3. A more refined visualization reveals that the United States is not as polarized by geography as suggested in the above visualizations. In 2000, Bob Vanderbei created a Purple America map, in which each region is colored in a shade of red, green, and blue, according to the proportion of votes received by each candidate. Specifically, if the Republican, Independent, and Democratic candidates receive a1, a2, and a3 votes, respectively, then we draw the subregion using the following formula:
Write a program Purple.java that takes two command-line arguments (the name of the map and the year of the election) and produces a Purple-America map, as in the examples below:
% java Purple USA |
% java Purple NJ 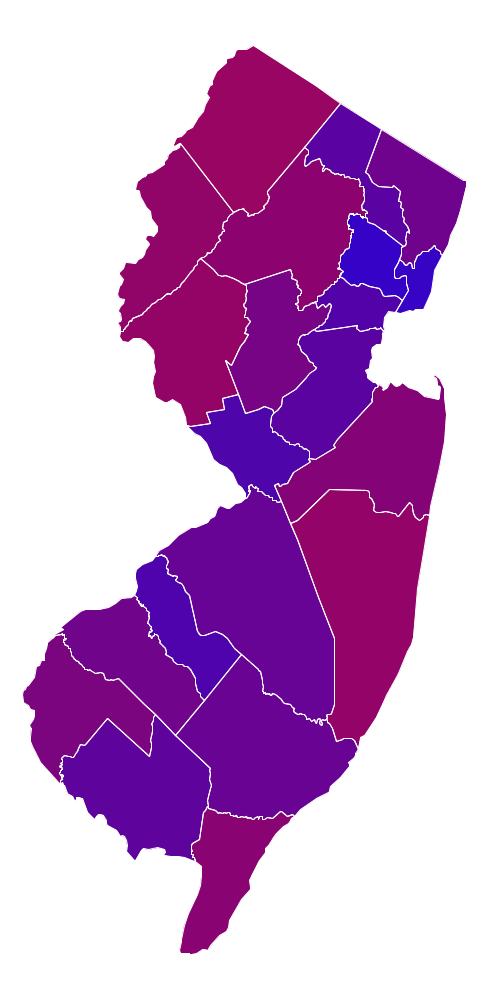
|
% java Purple USA-county 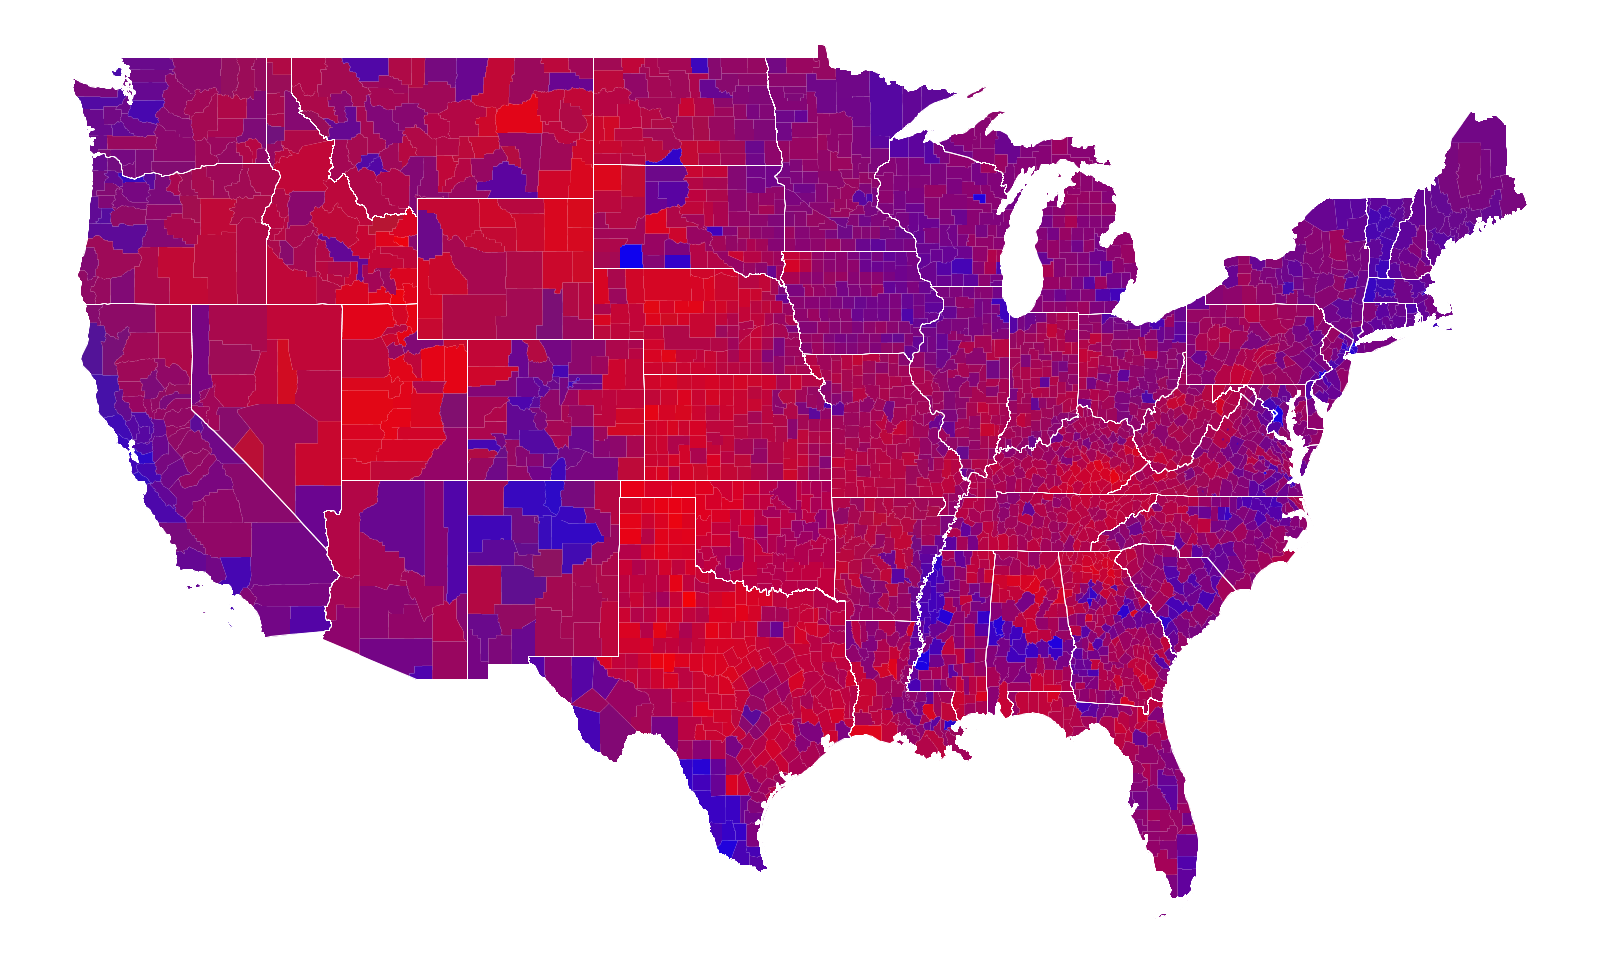
|
Extra credit. There are limitless opportunities for creativity, enrichment, and inspiration.